
Celestia (TIA) Price Sees 17% Increase, Upswing Poised to Continue
 beincrypto.com 10 July 2024 10:43, UTC
 Exactly five months ago, the native token of modular blockchain Celestia (TAI) reached an all-time high (ATH) of $20.09. However, after that, the price fell by 65.37% before it noted a significant recovery starting Tuesday, July 9.
In the last 24 hours, TIA’s price has increased by 17.36%. Currently trading at $7.16, analysis reveals that the cryptocurrency is not done with the hike. Here is how.
Celestia Bulls Finally Find a Way
Before it emerged as the highest gainer today, Celestia reached its lowest price since November 2023 on July 5. The price as of then was $4.78, meaning it was 80% down from its ATH.
According to the daily TIA/USD chart, the extended decline led to a descending channel formation. A descending channel is a technical chart pattern that indicates a downtrend in the price of a cryptocurrency.
This pattern is bearish as it shows lower highs and lower lows during the period marred by a downturn and consolidation in between.
Read More: Best Upcoming Airdrops in 2024
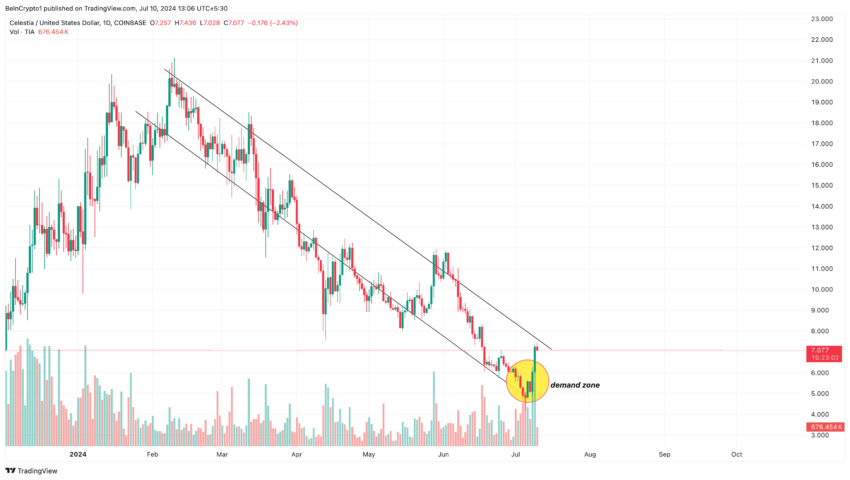
From the chart above, bulls seem to have taken advantage of the decline by creating a good level of demand between $5.06 and $6.09.
If sustained, Celestia may continue to experience a breakout to the upside. Meanwhile, Satoshi Flipper, a trader, commented on TIA’s potential price action.
According to Satoshi Flipper, the long consolidation the token experienced can lead to incredibly higher prices.
“Break out of this 8-month long consolidation channel @ $8.50 for the real fun to begin … the longer the consolidation, the harder the pump.” He wrote.
From an on-chain perspective, Santiment data reveals that sentiment around Celestia has changed for the better. Using the Weighted Sentiment metric, we observe that the rating of -0.633 on July 7 is 2.745 at press time.
Readings of this metric show if comments online about a project are positive or negative. If the reading is negative, it means the broader market shares a bearish sentiment.
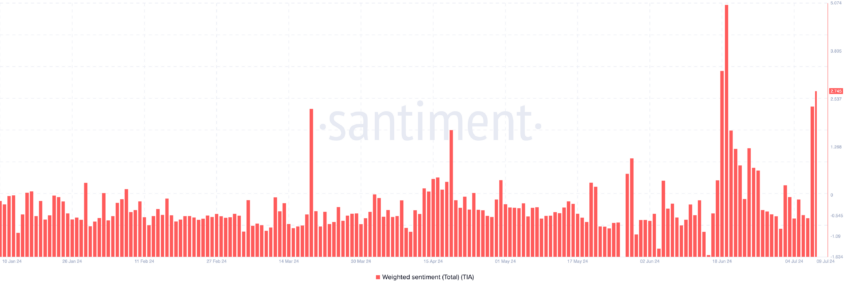
Since it is positive, it implies that optimistic mentions are about two times more than gloomy ones. If this remains the case, demand for the token could be higher.
TIA Price Prediction: Push Above Key Resistance Next
Another look at the daily chart shows that TIA has risen above the 20-day EMA (blue). EMA stands for Exponential Moving Average, and it measures trend direction over a period of time.
If the price is below the EMA, the trend is bearish. But when it is above it, the trend is bullish. Therefore, as long as TIA stays above the threshold, the price can continue to increase.
Furthermore, the token is on the brink of breaking above the 50-day EMA (yellow) at $7.51. If bulls successfully breach this region, the next target for the token will be $8.07.
In addition, the Relative Strength Index (RSI) is at 53.07. The RSI measures momentum by measuring the speed and size of price changes. Readings below 50.00 indicate that momentum is bearish.
Read More: Top 10 Aspiring Crypto Coins for 2024
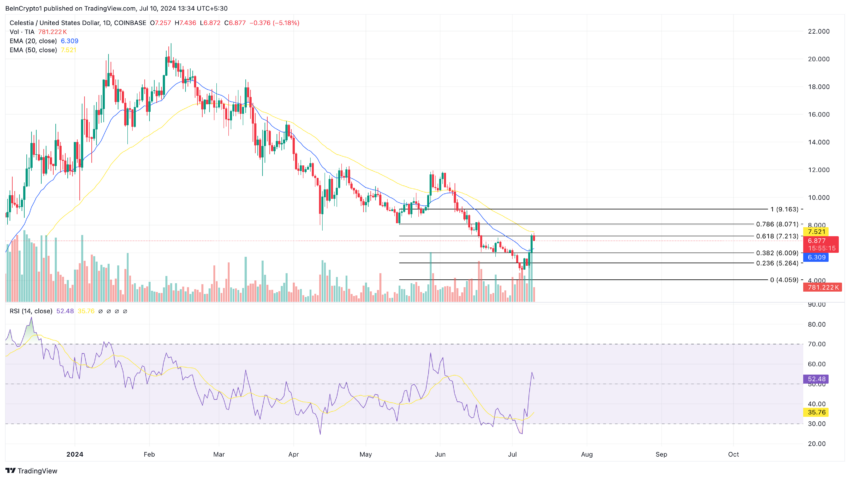
Thus, since TIA’s RSI has surpassed the midpoint, momentum is bullish. If the RSI continues to rise, the value of the token may also follow in the same direction, with short-term targets between $8.07 and $9.16.
Outside of the technical and on-chain parts, the Modular Summit, scheduled to be held on July 11, could also help TIA’s price sustain the uptrend.
However, this forecast will be considered null and void if sentiment around Celestia turns bearish. The price can also drop if profit-taking appears or fails to flip the 50 EMA. If this happens, TIA’s price will drop toward $6.00.


