XRP Bollinger Bands Tighten to Historic Levels, Mirroring Prior 60,000% Price Spike
 thecryptobasic.com 11 July 2024 08:16, UTC
 XRP Bollinger Bands recorded one of the tightest monthly squeezes in the asset’s history, which previously resulted in a 60,000% price rally.
The Great Mattsby (TGM), a seasoned technical analyst, called the investing public’s attention to this pattern in a recent analysis. Notably, the disclosure comes at a time when sentiments around XRP are generally down amid a persistent market downtrend.
XRP has followed the broader market’s bearish trajectory, having collapsed 40% from its yearly top of $0.7440. This downturn was triggered by Bitcoin’s (BTC) crash amid sustained selling pressure by the German government and Mt. Gox. Despite a mild recovery this week, the momentum remains bearish.
XRP Bollinger Bands Tighten Amid Consolidation
As bearish forces clash with a renewal of bullish pressure, the XRP market has slipped into a consolidation phase. TGM confirms that this occurrence has resulted in the tightening of the Bollinger Bands on the monthly timeframe.
$XRP has one of the tightest monthly Bollinger Band squeezes in its history and in all of crypto right now. The last time it squeezed like that it shot up 60,000% pic.twitter.com/WU1fspKkwz
— The Great Mattsby (@matthughes13) July 11, 2024
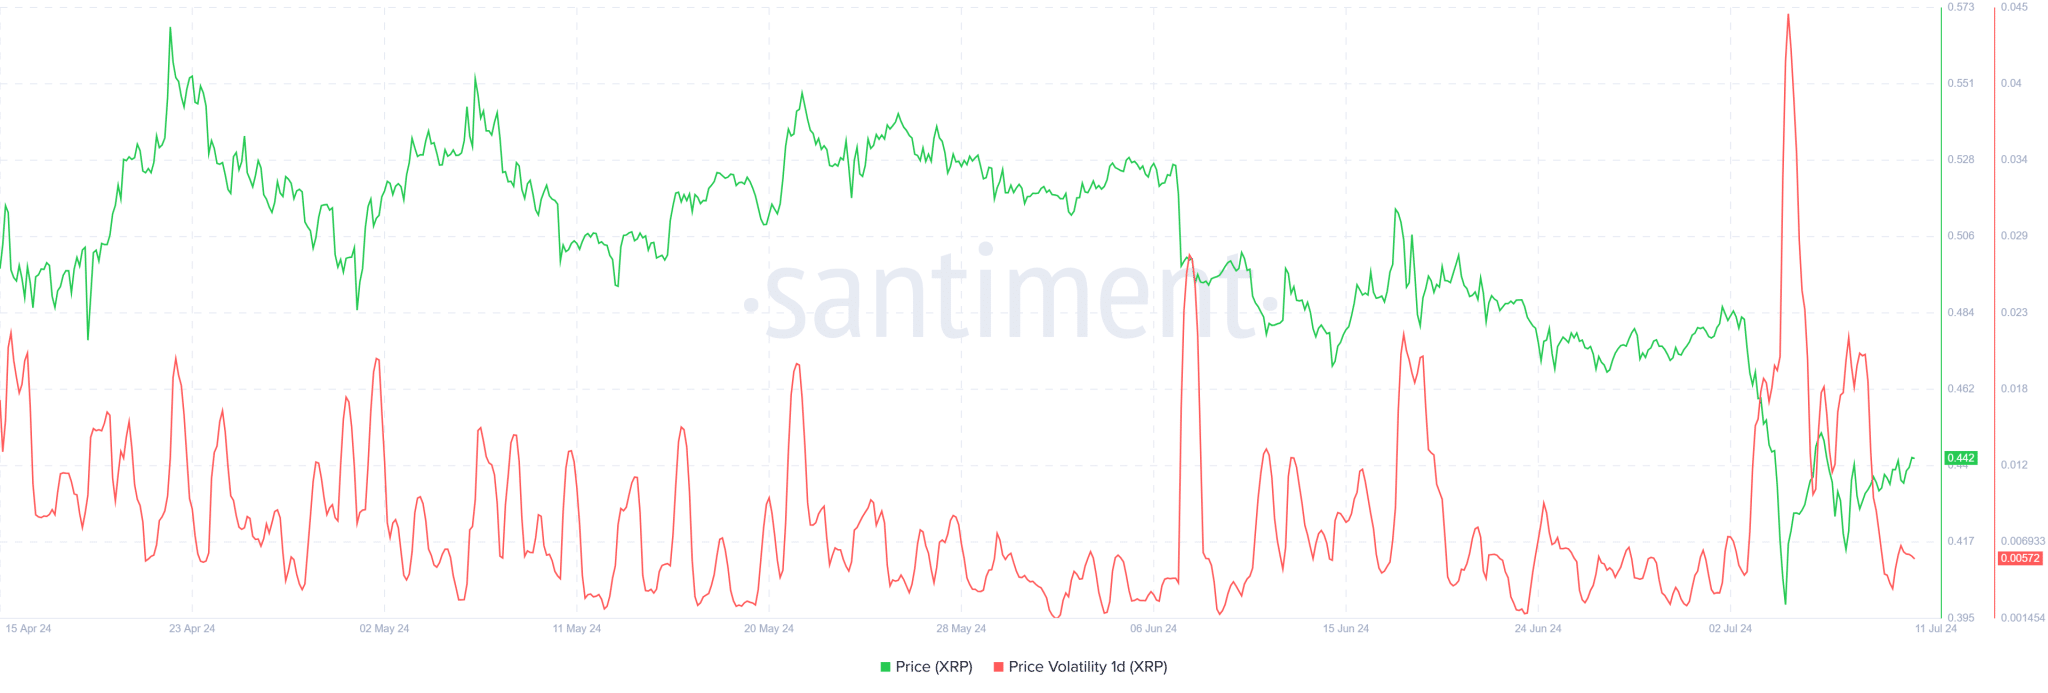
For the uninitiated, the Bollinger Bands tighten when the bands narrow, indicating low volatility in the market. This typically happens during periods of consolidation, where price movement is minimal. Santiment data indicates that XRP’s 1-day volatility has dropped to 0.00572 following a spike observed on July 5.
This tightening of the Bollinger Bands often precedes a significant price movement or breakout. The price explosion occurs as the market shifts from consolidation to a more active phase. Interestingly, the tighter the Bollinger Bands squeeze, the more explosive the market could get.
A Bullish Historical Precedent
According to TGM, XRP’s current squeeze is one of the tightest in the crypto asset’s history. The last time the XRP Bollinger Bands recorded such a tight squeeze on the monthly chart was in February 2017. At the time, XRP closed in February at a $0.00557 price.
Remarkably, following this squeeze, the market saw an explosive rally, culminating in the XRP all-time high of $3.31 in January 2018. This marked a 59,325% rally in a year. As the Bollinger Bands repeat this historic squeeze, analysts such as TGM expect another massive upsurge.
Multiple projections have sprung up based on varying technical indicators. For instance, this month, market watcher EGRAG set a $17 price target for XRP, citing his “Bent Fork” pattern. The Block Bull projected a 6,000% rise in XRP’s price against Bitcoin, translating to an XRP price of $25.
Notably, if XRP captured only half of the 59,325% rally in 2017, it could skyrocket 29,617% to $131. While this ambitious goal is unlikely to be attained, the consensus of a price explosion in the future remains. XRP currently changes hands at $0.4423, down 7.05% in July but up 5% since Monday.


