
Ethereum on-chain activity reveals mixed signals amid declining inflation
 fxstreet.com 12 July 2024 02:10, UTC
 - Ethereum could rally in Q3 following reduced US inflation and launch of spot ETH ETFs.
- Ethereum’s on-chain activity shows mixed sentiment among investors.
- Bearish exhaustion candle could signify a downturn for ETH if SEC delays ETH ETF approval.
Ethereum (ETH) is up 0.5% on Thursday following cooling inflation reports in the US. However, mixed on-chain sentiment signals uncertainty among investors despite the potential launch of spot ETH ETFs.
Daily digest market movers: CPI data, mixed on-chain signals, increasing supply
Ethereum’s price is expected to react positively in the coming days to the recent decline in the US Consumer Price Index (CPI), a metric for measuring the cost of goods and services. The CPI for June declined by 0.1% from May, beating market expectations and reaching a three-year low. As a result, many expect the Federal Reserve (Fed) to cut rates in September.
Combined with the potential launch of spot ETH ETFs in the coming days, many expect Ethereum to have a positive Q3. This also aligns with predictions from JP Morgan analysts that the crypto market will rebound in August.
Also, on-chain activity shows that Ethereum has been facing a flurry of exchange deposits and withdrawals in the past 24 hours, according to data from Lookonchain. This shows mixed sentiment and uncertainty among ETH investors. As some are de-risking, others are accumulating their selling pressure, keeping the price of ETH in a somewhat horizontal trend.
The key transactions include Golem pausing its ETH selling spree after staking 40,000 ETH, a whale depositing 10,000 ETH into Binance, another withdrawing 16,074 ETH in the past week, and HTX founder Justin Sun increasing his ETH holdings.
Meanwhile, despite increasing staking deposits, ETH’s supply has started trending upwards since the Ethereum Dencun upgrade in March. As the chart from Bitwise below shows, ETH’s supply trended downward to -450K between The Merge and Q1 ’24. It started moving upwards in Q2’24 following the Dencun upgrade. If ETH continues on this path, it will lose its deflationary status.
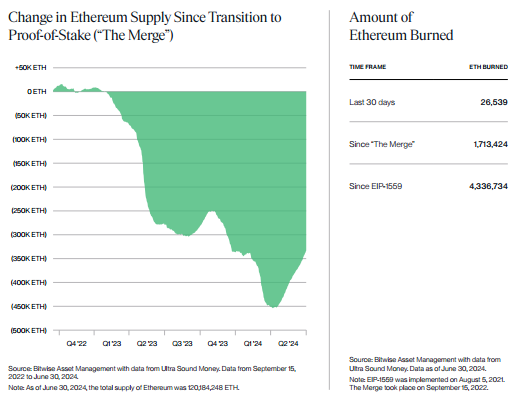
ETH Supply change since The Merge
ETH technical analysis: Ethereum posts bearish exhaustion candle
Ethereum is trading around $3,125 on Thursday, up 0.5% on the day. ETH has seen $26.27 million in liquidations in the past 24 hours, with long and short liquidations accounting for $17.05 million and $9.23 million, respectively.
While the market remains gloomy, ETH is taking a slow ride up, offsetting its weekly losses as the market anticipates the launch of spot ETH ETFs.
However, ETH posted a bearish exhaustion candle on the 8-hour time frame after attempting to sustain a move above the $3,200 price. An exhaustion candle has a long wick 2-3 times the length of its body and little or no wick on the other side. If a bearish exhaustion candle appears during an uptrend, it indicates bulls may be losing momentum, and vice versa if a bullish exhaustion candle appears during a downtrend.
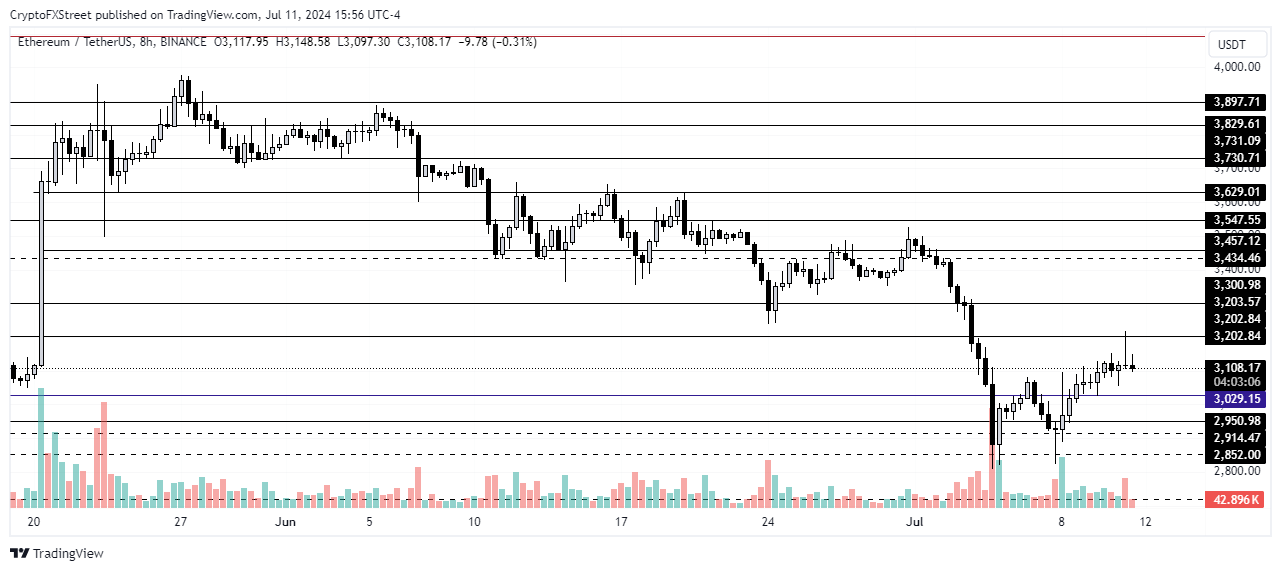
ETH/USDT 8-hour chart
In the case of ETH, the reversal suggests that some of the over 2 million addresses that purchased ETH around $3,200 sold as they broke even, according to earlier predictions.
While it seems ETH may tilt toward the downside after the bearish exhaustion candle, optimism from lower-than-expected CPI data and the Securities & Exchange Commission (SEC) approving issuers’ ETH ETF S-1 drafts may see it attempt another move above the $3,200 price level. The move up may see $3.73 million worth of shorts being liquidated around the $3,222 price level.
However, if the SEC continues delaying approval of ETH ETF, Ethereum will likely fall back to the $2,900 to $3,000 price level.


