
Ethereum Price Reclaims $3,200 on Dovish CPI Report: What Next?
 thecryptobasic.com 12 July 2024 10:42, UTC
 Ethereum price gained 14% within the 7-day timeframe, as reclaimed the $3,200 territory on July 11, on-chain data trends suggest ETH retail traders could pile on more demand in the days ahead.
Ethereum Price Bounces 5% on Positive CPI Report
Ethereum price bounced 5% within the daily timeframe on June 11 as the crypto markets reacted positively to the latest US economy inflation report. On Wednesday, the US Bureau of Labour Statistics published the Consumer Price Index (CPI) report which showed that inflation slowed for the first time in 4 years, adding more luster to calls for interest rate cut.
The dovish US CPI report of June 2024 sparked a way of buying pressure across the crypto markets, but Ethereum’s ETF impending launch further fuelled the ETH price surge on Thursday.
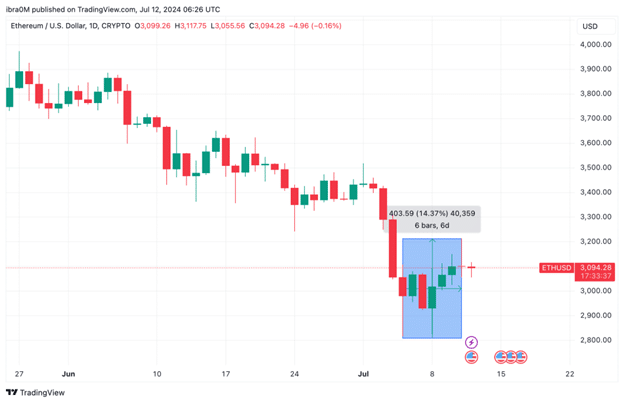
Looking at the chart above, Ethereum price surged by more than 4% on Thursday, to reach a weekly timeframe top of $3,213 on Thursday, July 11, marking a 14.37% recovery from the 100-day low record during the market crash last Friday.
While the positive CPI report, and louder calls for rate cuts have boosted investor confidence across all risk assets markets, ETH price is also receiving bullish tailwinds from the Ethereum ETF anticipated launch slated for July 15 according to Bloomberg analysts.
After Thursday’s gains, the ETH price retraced toward the $3,100 level at the time of writing on Friday, July 12. However, according to on-chain data, more retail traders are looking to pile on additional demand for Ethereum as the ETF launch date draws closer.
The exchange order book data from IntoTheBlock provides comprehensive information on the total number of active buy and sell limit orders for a specific asset. This data is aggregated from 16 well-established cryptocurrency exchanges, such as Binance and Coinbase.
A higher volume of buy orders often precedes a price bounce, as it means that market demand has exceeded the current short-term supply of the asset and vice versa.
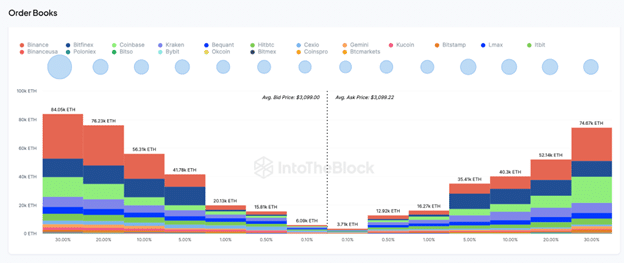
The chart above depicts that Ethereum buyers have listed active bids to purchase 300,000 ETH at the average price of $3,099. Meanwhile traders have only placed 232,000 ETH up for sale close to the current prices.
Essentially, this means there is currently an excess market demand for over 68,000 ETH. Valued at the current prices, the bears must now place another $321 million worth of sell-pressure to halt Ethereum’s current price rebound phase.
But with the spot Ethereum ETFs due to launch in less than a week, existing ETH investors could opt to sit-and-watch approach and consolidate on their holdings. Other strategic short-term traders may also be waiting to sell into the expected market euphoria around the launch date.
As this cooling sell-side pressure persists on the dovish CPI report and the anticipated ETF launch, ETH price could be on the verge of a parabolic breakout towards $3,500.
Ethereum Price Forecast: ETH Bulls Can Target $3,500 Rebound
Ethereum (ETH) has shown signs of recovery, currently trading at $3,092.12 as of July 12. The price has rebounded by 14.37% over the past six days, suggesting a potential continuation of the bullish trend. The Parabolic SAR indicator at $3,256.23 signals a possible upward momentum, with ETH aiming to break key resistance levels.
The immediate resistance is at the Parabolic SAR level of $3,256.23. A break above this could open the door for a retest of the $3,500 level, a significant psychological and technical barrier. The Relative Strength Index (RSI) is at 39.20, indicating that ETH is still in the oversold territory but showing signs of recovery. If the RSI continues to rise, it could further confirm the bullish outlook.
Support levels are crucial to monitor in the event of a pullback. The first support level to watch is around $3,000, which has proven to be a strong psychological support. Below this, the next significant support is at $2,800. A drop below $3,000 could weaken the bullish momentum and lead to a retest of the lower support levels.
In summary, Ethereum’s price action and technical indicators suggest a bullish outlook with a target of $3,500. Traders should watch the key resistance at $3,256.23 and the support at $3,000. A successful break above the resistance could see ETH retesting $3,500 while maintaining support at $3,000, which is crucial for sustaining the bullish momentum.


