
Bitcoin Technical Analysis: Bulls Held Back by Selling Pressure and Key Resistance
 news.bitcoin.com 12 July 2024 12:56, UTC
 Bitcoin’s price on July 12, 2024, exhibits a clear bearish trend across multiple timeframes. The leading cryptocurrency’s current price stands at $57,237, with a notable intraday range from $56,608 to $59,516.
Bitcoin
On the 1-hour chart, bitcoin shows a decline from a high of $59,516, forming lower highs and lower lows, indicative of a bearish trend. High trading volume is observed during significant price drops, especially around the larger ones, signifying stronger selling pressure. Conversely, the lower volume on the upswings points to weak buying interest.
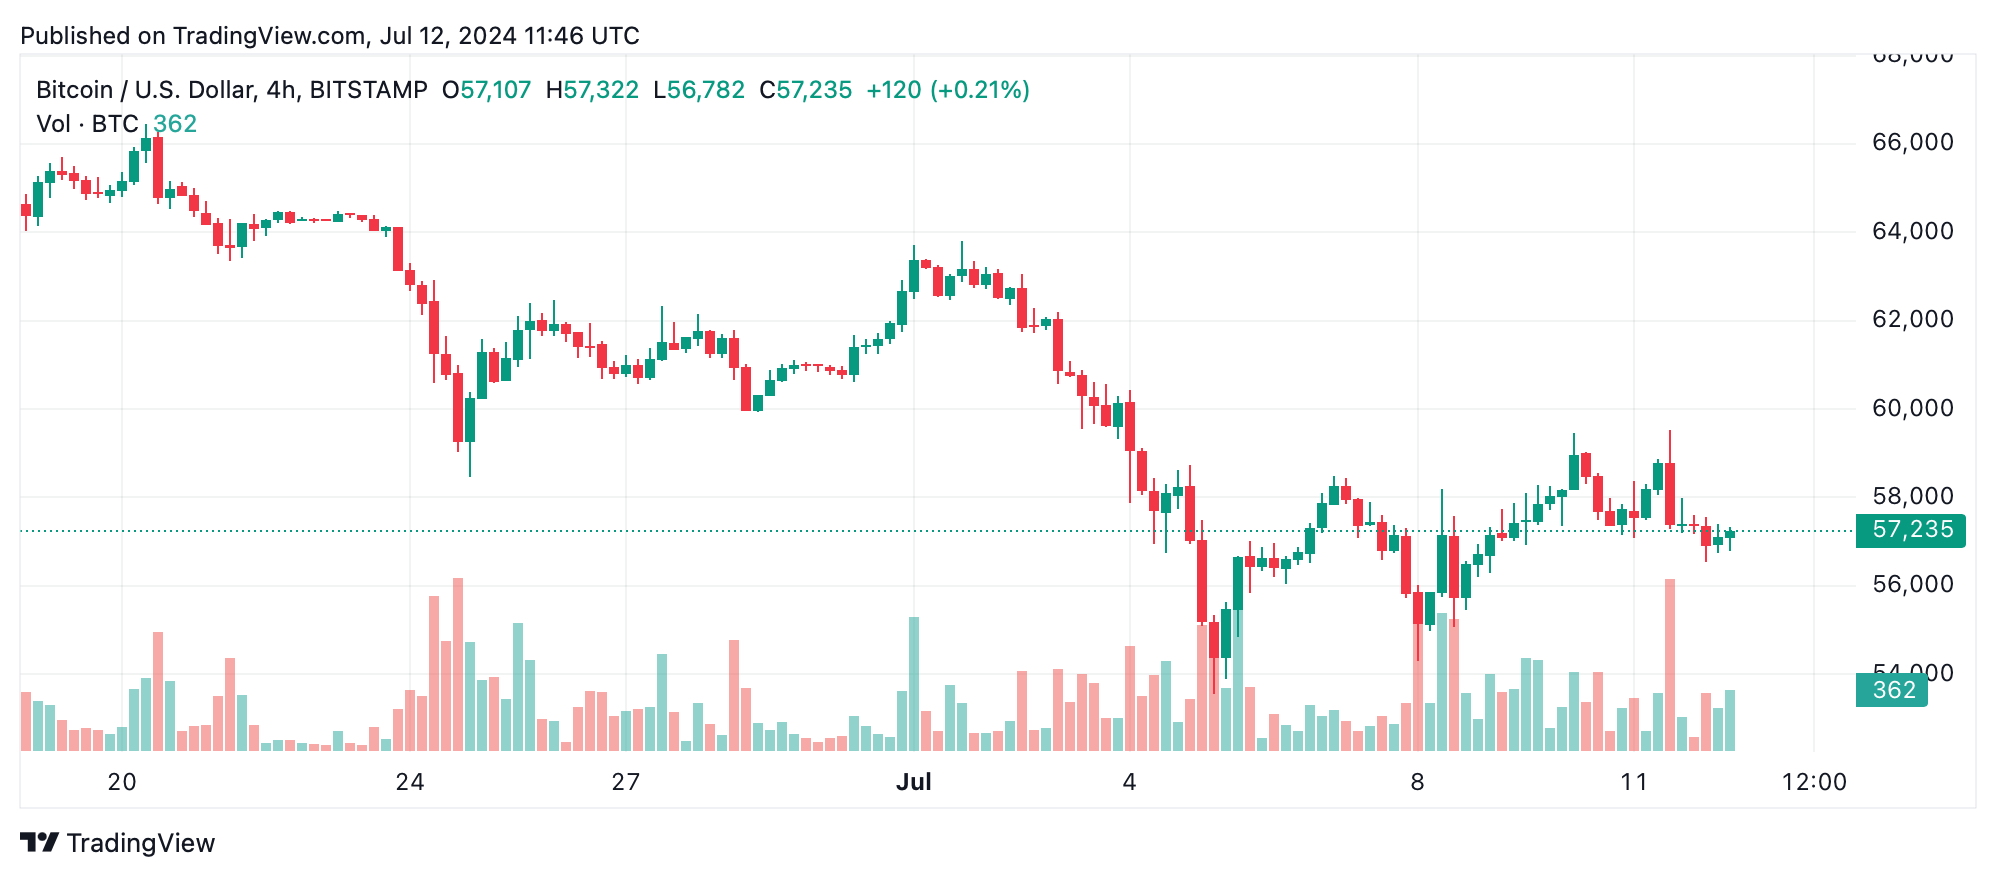
The 4-hour chart reflects a similar bearish pattern, more pronounced with highs at $59,516 and lows at $54,296. Strong selling pressure is evident from the volume spikes accompanying significant price movements, while weaker volume on the rises suggests unsuccessful attempts to push the price higher.
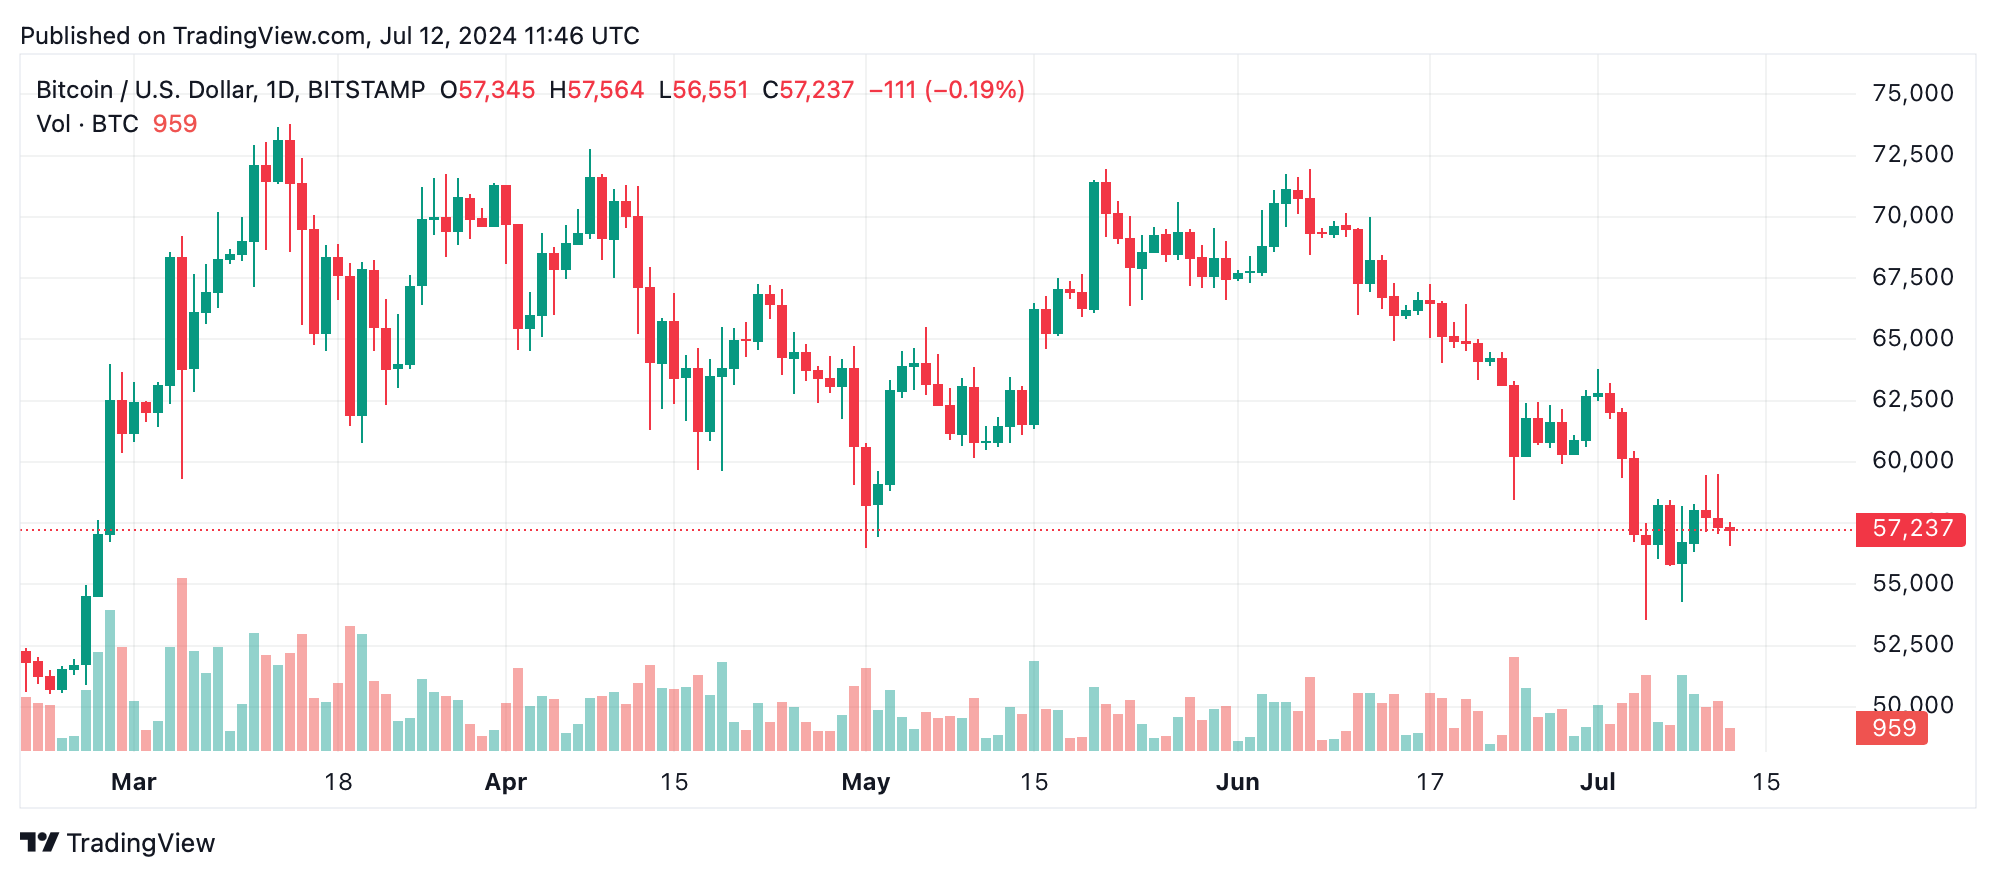
Daily chart analysis shows a pronounced bearish trend with historical highs at $70,167 on June 9 and lows at $53,550 on July 4. Consistent lower highs and lower lows over a longer period reinforce the bearish outlook. High volume during price declines confirms strong selling pressure, while low volume on price increases indicates minimal bullish resistance.
Oscillators reveal mixed signals, with most indicators such as the relative strength index (RSI), Stochastic, and commodity channel index (CCI) in neutral zones, reflecting indecision in market momentum. Notably, the momentum indicator suggests a bullish signal, while the moving average convergence divergence (MACD) level indicates bearish pressure, presenting a conflicting short-term outlook. This necessitates careful monitoring of these indicators for any shifts in market sentiment.
Moving averages (MAs) across various periods (10, 20, 30, 50, 100, and 200) uniformly indicate a bearish signal, reinforcing the overall negative sentiment. The consistent selling pressure observed through these averages suggests that bitcoin may continue to face downward pressure unless a significant reversal occurs, supported by strong buying volume and positive market catalysts.
Bull Verdict:
Despite the current bearish indicators, if bitcoin’s price finds strong support around the $54,000 to $55,000 range and we see a significant increase in buying volume, a potential reversal could occur. Key exit targets around $58,000 to $59,000 would then present profitable opportunities, assuming resistance levels can be overcome.
Bear Verdict:
Given the consistent bearish trends across multiple timeframes, along with the dominant bearish signals from MAs and oscillators, bitcoin is likely to continue its downward trajectory. High selling pressure and weak buying interest suggest that entry points should be carefully considered around $55,500, with exit targets between $58,500 to $59,000 to capitalize on minor recoveries within the broader bearish market.


