
Ethereum Technical Analysis: ETH’s Bullish Momentum Continues Amid Uptrend
 news.bitcoin.com 15 July 2024 12:52, UTC
 As of July 15, 2024, ethereum (ETH) maintains its bullish trajectory, showing promising signs across various technical indicators. With its current price at $3,341 and a market capitalization of $401 billion, ether has demonstrated strong performance over recent trading sessions.
Ethereum
The 1-hour chart illustrates ethereum’s short-term uptrend, moving from a low of $3,171 to a high of $3,374. Key support levels are identified at $3,300 and $3,171, while resistance is established at $3,374 per ETH. Despite minor corrections and consolidations marked by downturns, the overall direction remains upward, supported by volume peaks during significant price movements.
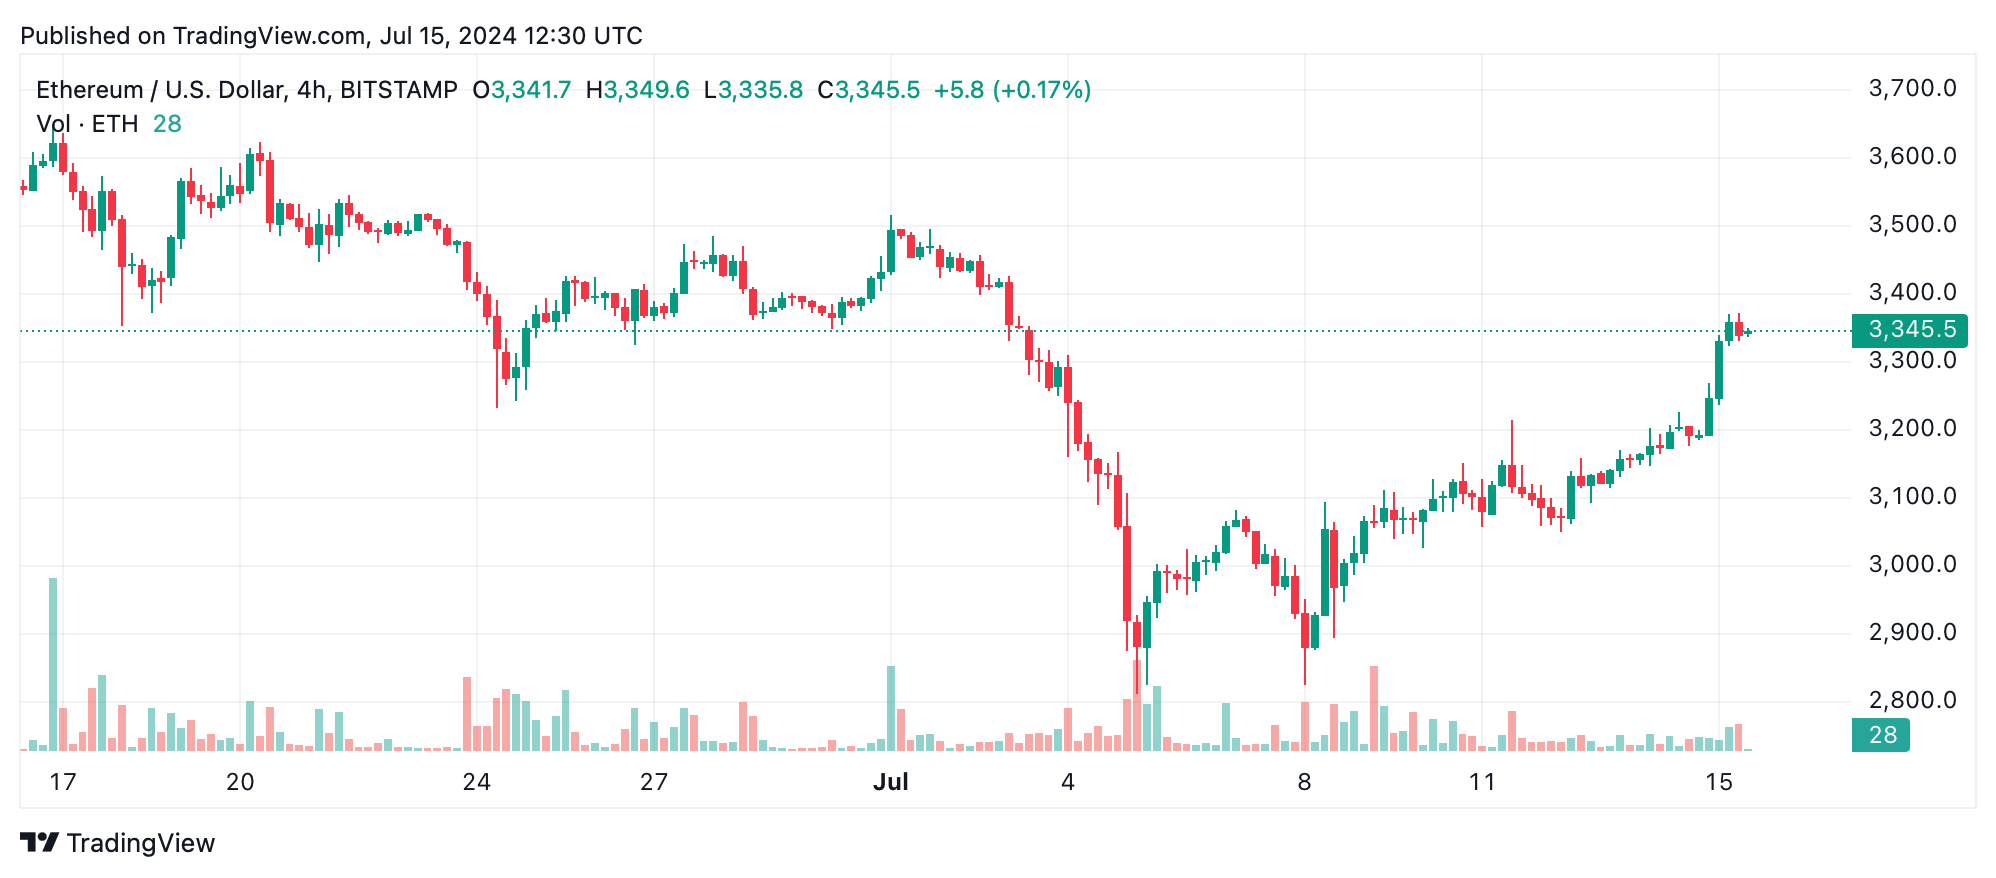
Examining the 4-hour chart, a clear uptrend is evident since July 10, with ethereum rising from $3,024 to $3,374. Immediate support is found at $3,250, with resistance at $3,374. The formation of consecutive upswings with higher highs and lows indicates strong bullish momentum. Although occasional pullbacks occur, the general trend is upward, reinforced by volume spikes during price increases.
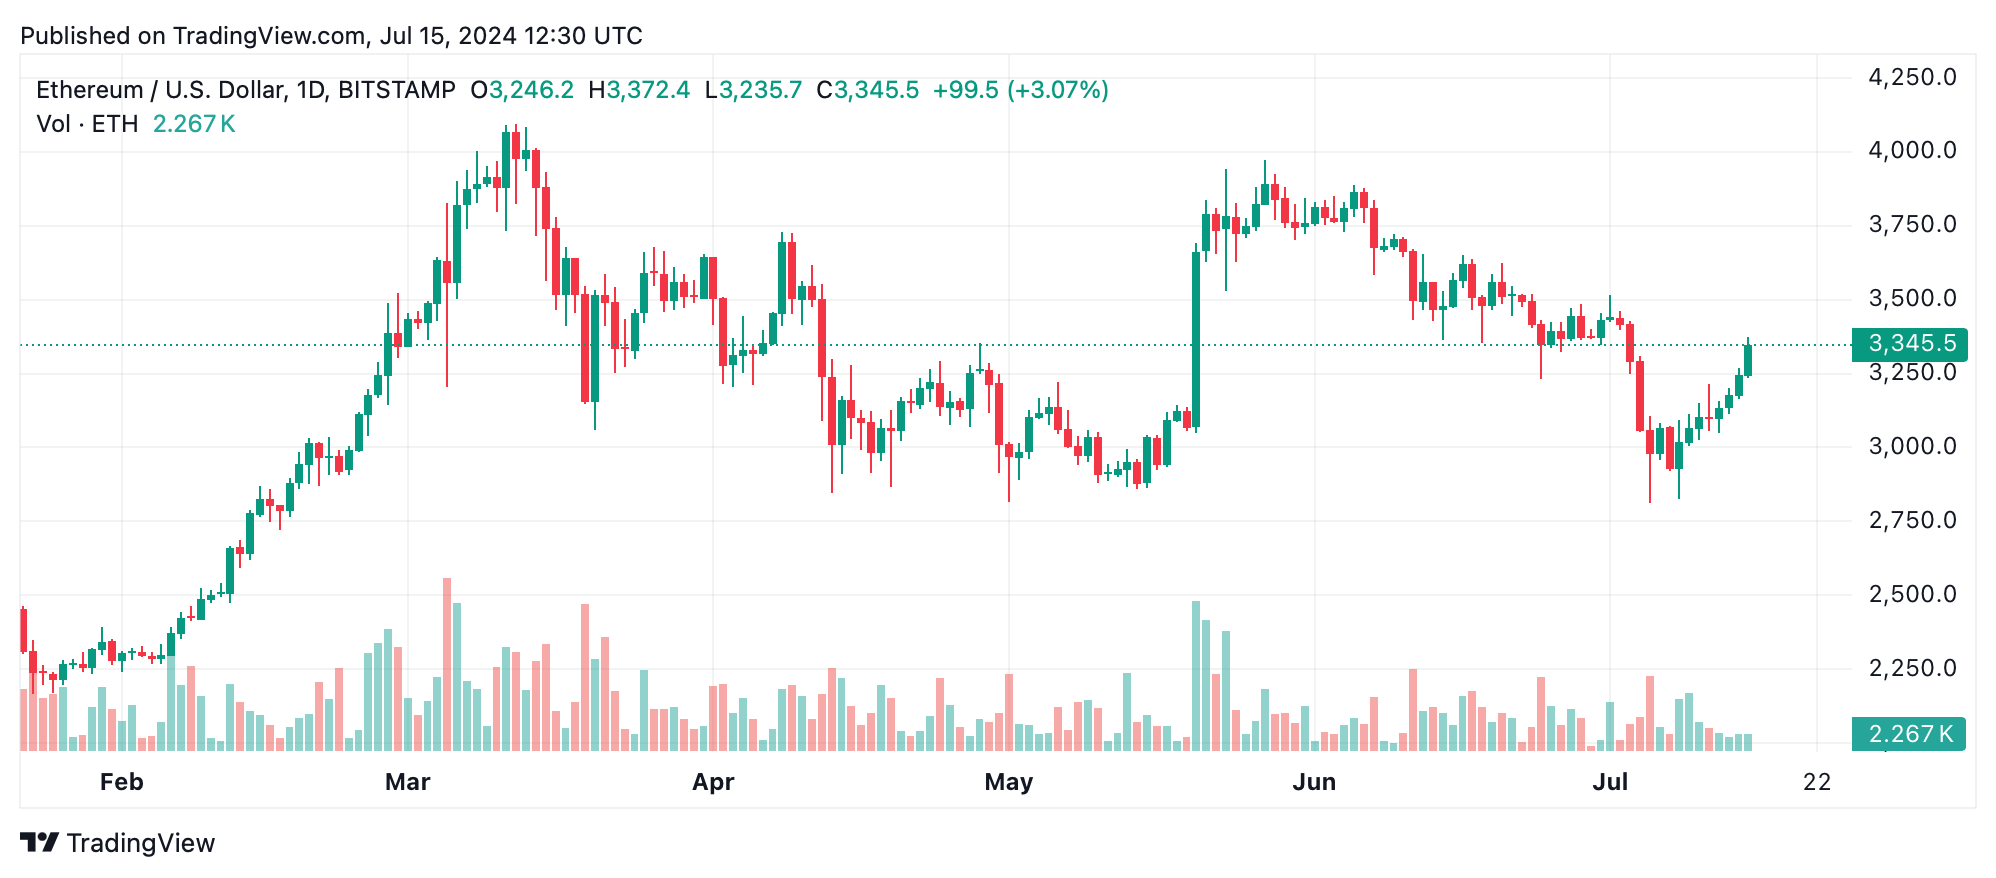
The daily chart highlights a significant downtrend starting in early June, bottoming out at $2,803, followed by a recovery phase. Key support is noted at $2,803, with resistance levels at $3,656 and $3,374. Large downturns in late June signify strong selling pressure, while the recent upswings reflect a bullish sentiment and recovery. Volume spikes correspond to major price movements, especially during the downtrend and initial recovery stages.
Oscillator readings provide further insights, with most indicating a neutral position. The relative strength index (RSI) stands at 54.7, Stochastic at 65.3, the commodity channel index (CCI) at 42.1, the average directional index (ADX) at 34.8, and the awesome oscillator at -148.1, all suggesting a neutral market. However, momentum at 363.5 and moving average convergence divergence (MACD) level at -69.1 signal bullish action, hinting at potential upward movements.
Moving averages (MAs) paint a bullish picture, with several indicating a positive signal. The exponential moving average (EMA) and simple moving average (SMA) across 10, 20, 30, 50, 100, and 200 periods predominantly suggest a bullish action. Only the 50-period SMA indicates negative sentiment, with a value of $3,467. The convergence of these MAs supports the overall bullish outlook for ethereum.
Bull Verdict:
Based on the current technical analysis, ether exhibits strong bullish momentum across various timeframes. With key support levels holding firm, positive signals from moving averages, and volume spikes during price increases, the outlook remains optimistic for further upward movement. Traders should consider this a favorable period for potential gains.
Bear Verdict:
Despite the recent bullish indicators, caution is warranted due to the presence of strong resistance levels and occasional pullbacks. If key support levels are breached or if bearish oscillators gain prominence, ethereum could face downward pressure. Traders should remain vigilant and prepared for potential corrections.


