
Ethereum (ETH) Whale Activity Heats Up as ETF Anticipation Grows
 coinedition.com 15 July 2024 23:58, UTC
 Ethereum (ETH) has experienced notable transfers between wallets and exchanges, reflecting dynamic market activity.
According to blockchain tracker Whale Alert, approximately 11,999 ETH, valued at $40,178,586, was transferred from an unknown wallet to Kraken.
11,999 #ETH (40,178,586 USD) transferred from unknown wallet to #Krakenhttps://t.co/zRDhaCh0cZ
— Whale Alert (@whale_alert) July 15, 2024
Concurrently, 9,438 ETH worth $31,571,639 moved from another undisclosed wallet to Binance. Additionally, 11,913 ETH amounting to $39,880,410 was transferred from Gemini to Coinbase, underscoring substantial transactions within the ETH ecosystem.
ETH has exhibited a robust trading session with distinct support and resistance levels shaping its price dynamics. $3,200 emerged as a resilient support level, with buying interest keeping the price above this threshold. Further, $3,250 served as a consolidation point following an initial upward surge, suggesting a stabilizing phase before potential further gains.
On the resistance side, the current price around $3,336.34 poses an immediate hurdle, with minor sell-offs observed, reflecting initial resistance levels. A breakthrough above $3,350 could signal a continuation of the upward trend, highlighting key resistance points to monitor in upcoming trading sessions.
The price action depicted a bullish trend, starting from around $3,200 and steadily climbing to the current levels near $3,336. This upward trajectory was accompanied by a notable 34.06% increase in trading volume over the last 24 hours, indicating heightened market activity and investor interest in ETH.
In broader market indicators, Ethereum’s market cap rose 4.22%, reaching $401,088,479,399, underscoring positive sentiment among investors. The substantial trading volume of $13,154,601,411 further emphasized strong market participation and liquidity, supporting the bullish price trend observed throughout the day.
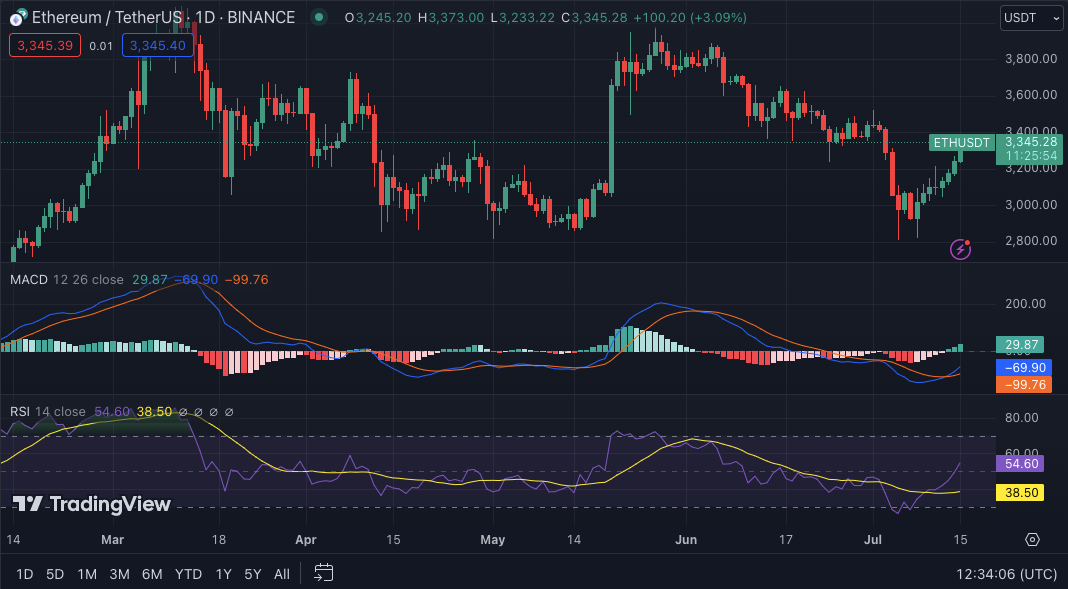 Ethereum/USD 1-week price chart, Source: Trading view
Analyzing technical indicators, Ethereum’s 1-week RSI stood at 54.02, indicating a neutral market sentiment. Meanwhile, the 1-week MACD trading below the signal line suggests potential short-term downward pressure on prices.
Disclaimer: The information presented in this article is for informational and educational purposes only. The article does not constitute financial advice or advice of any kind. Coin Edition is not responsible for any losses incurred as a result of the utilization of content, products, or services mentioned. Readers are advised to exercise caution before taking any action related to the company.


