Daily Market Review: BTC, ETH, PEPE, WIF, MANTRA
The bulls are still in control in today’s session, as seen from the increase in the global market cap. The total cap stood at $2.34T as of press time, representing a 1.92% increase over the last 24 hours, while the trading volume also jumped by 47.17% over the same period to stand at $86.4B as of press time.
Bitcoin Price Review
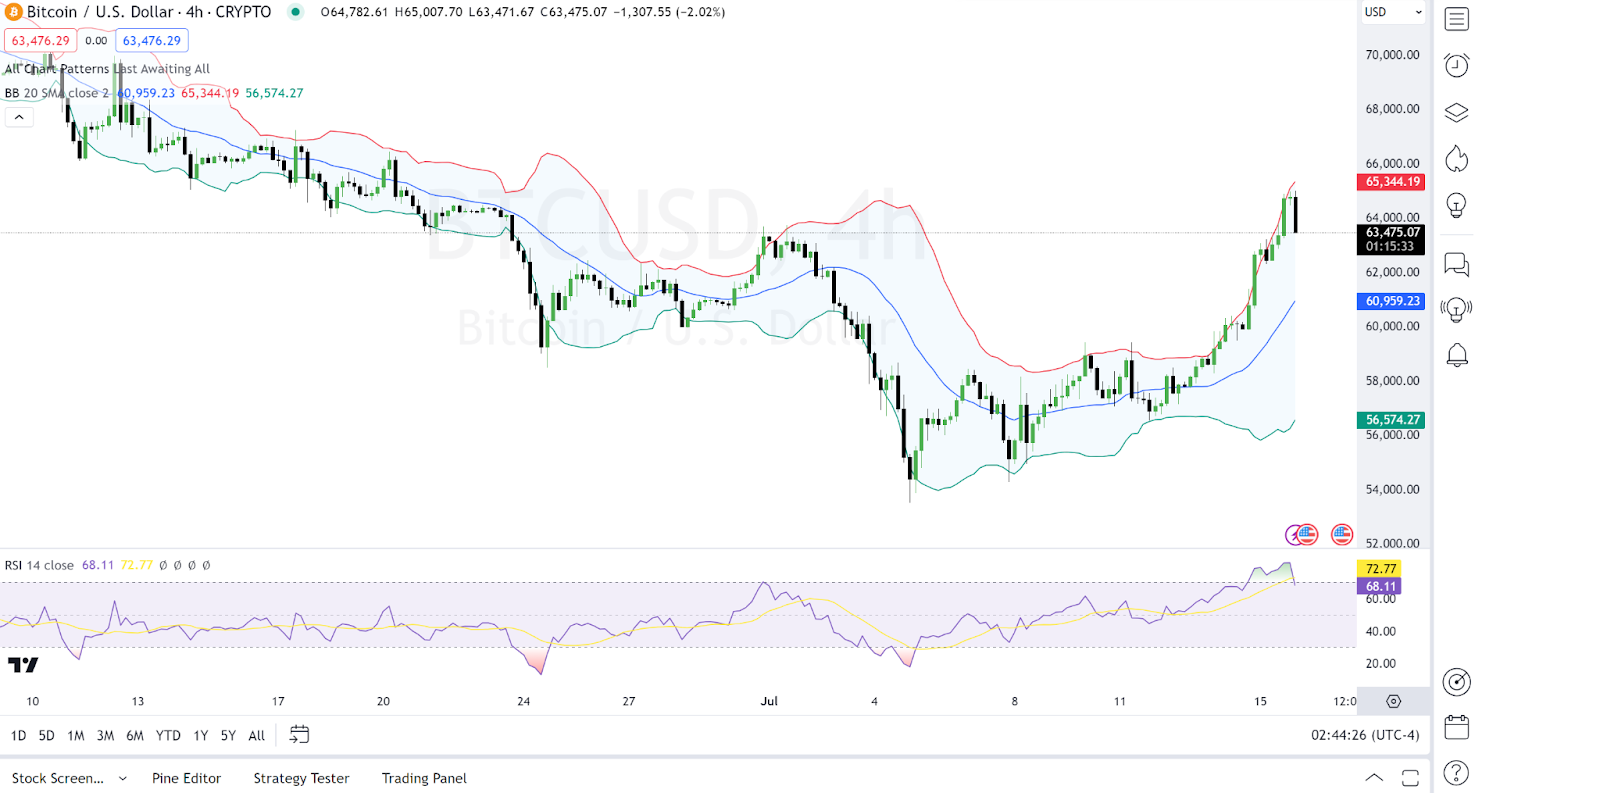
Bitcoin $BTC is among the gainers in today’s session, as seen from its price movements. In-depth chart analysis shows Bitcoin prices moving towards the upper Bollinger Band, indicating a bullish trend with possible overbought conditions.
On the other hand, the RSI is around 68.11, approaching the overbought level of 70. This suggests that the price may experience a pullback soon. As of press time, Bitcoin traded at $63,085, representing a 0.16% increase over the last 24 hours.
Ethereum Price Review
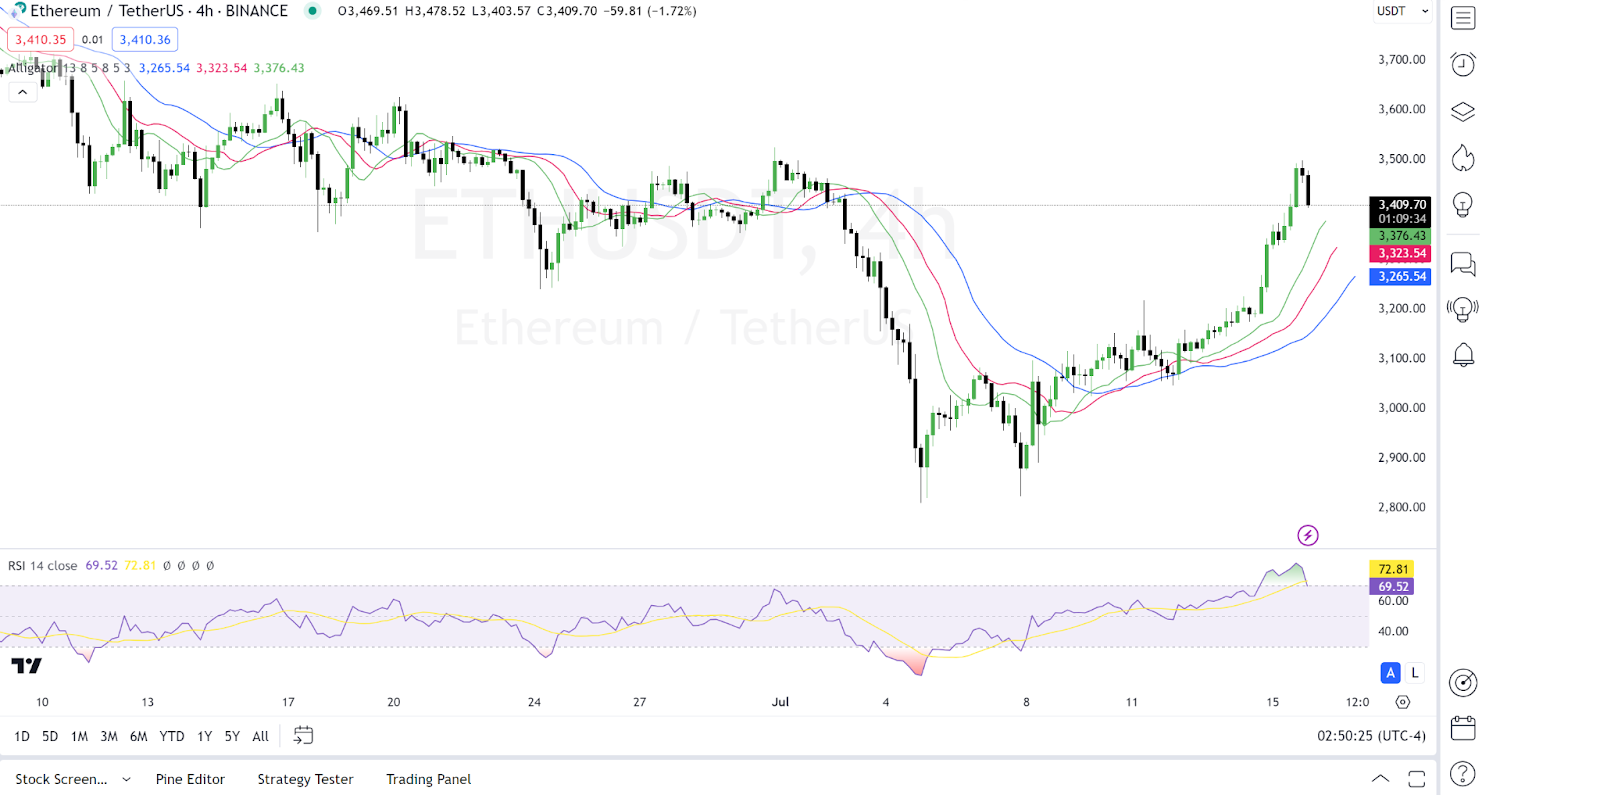
Ethereum (ETH) also gained in today’s session, as seen from the price movements. In-depth analysis shows that the chart indicates multiple moving averages (likely 13, 21, 34, 55) showing a bullish alignment, with shorter periods above the more extended periods.
On the other hand, the RSI is around 69.52, very close to the overbought threshold of 70. This signals the potential for a price correction or consolidation. Ethereum traded at $3,396 as of press time, representing a 1.09% increase over the last 24 hours.
Pepe Price Review
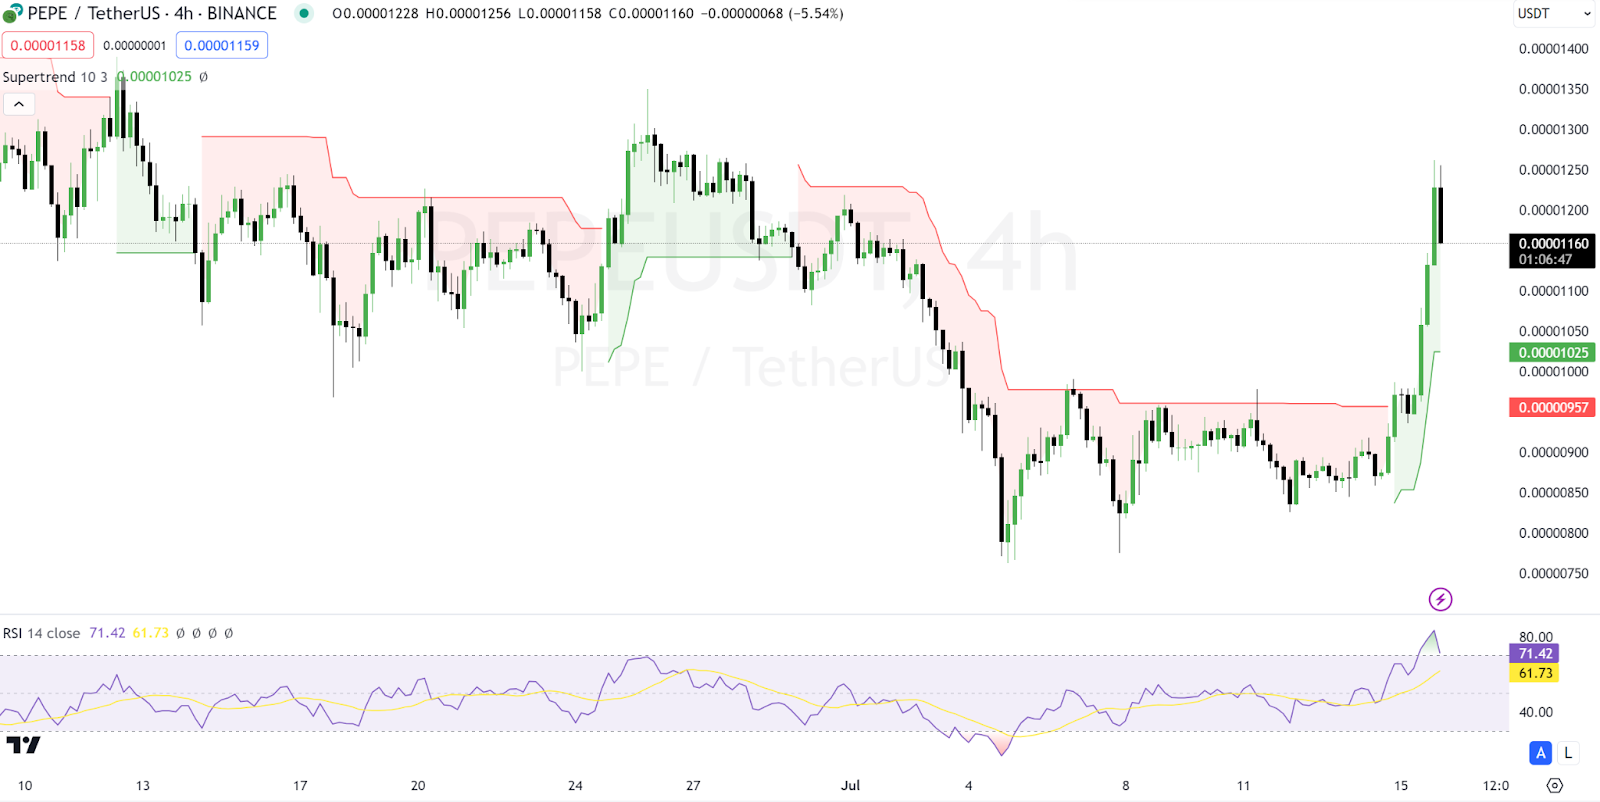
Pepe $PEPE is another gainer in today’s session, as seen in the price movements. Looking at an in-depth analysis, the Supertrend indicator shows a recent bullish signal, with prices moving above the Supertrend line.
On the other hand, the RSI is at 71.42, indicating overbought conditions. This might lead to a short-term price correction. Pepe traded at $0.00001174 as of press time, representing a 20.93% increase over the last 24 hours.
Dogwifhat Price Review
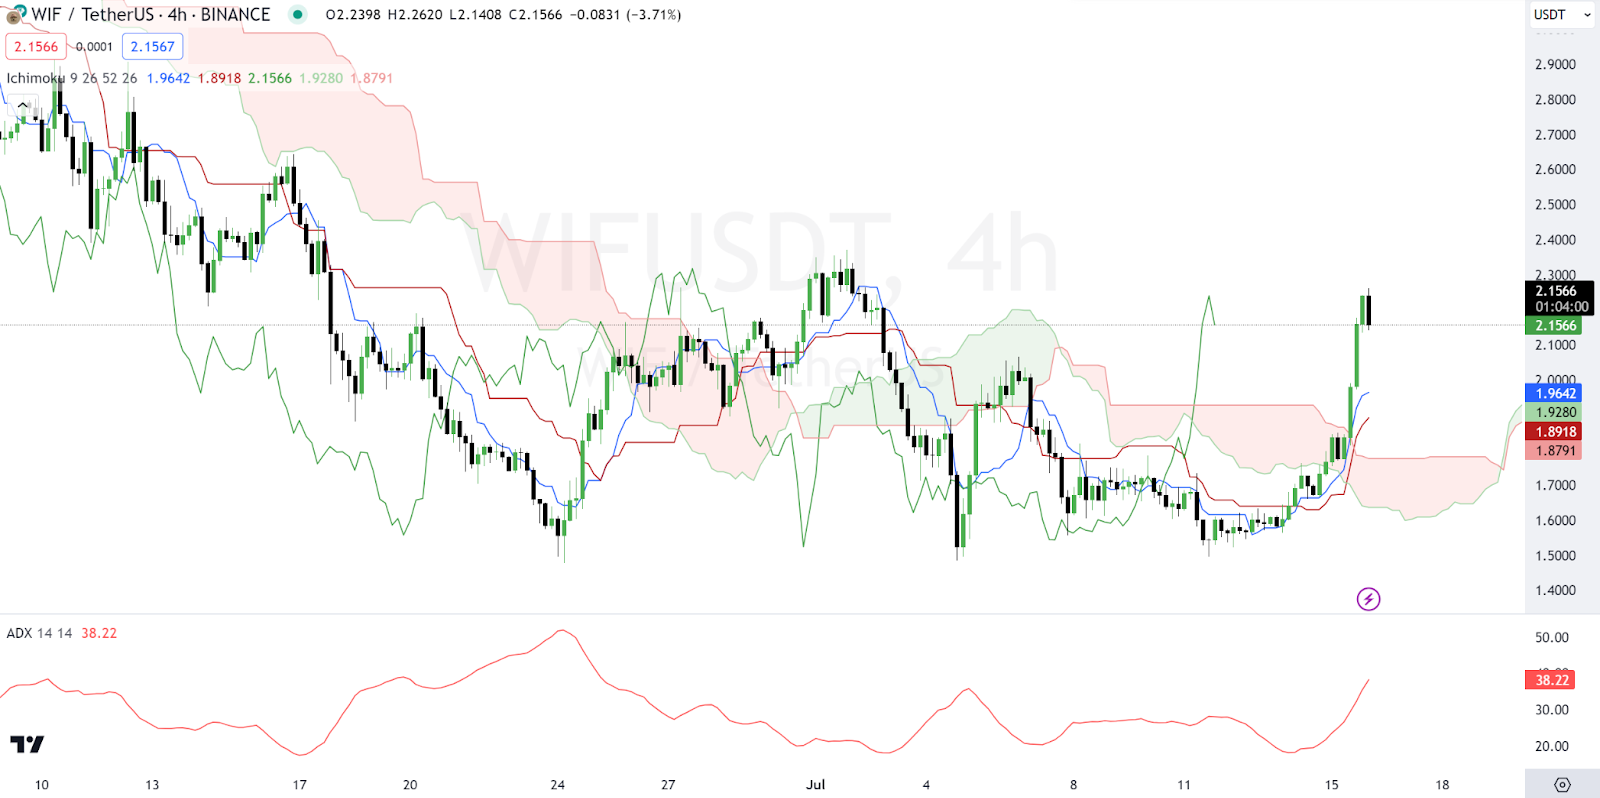
Dogwifhat $WIF is also among the gainers in today’s session. The Dogwifhat price is currently above the Ichimoku Cloud, a bullish signal. The lagging span is also in a favorable position.
On the other hand, the ADX is at 38.22, indicating a strong trend. As of press time, Dogwifhat traded at $2.16, representing a 19.29% increase over the last 24 hours.
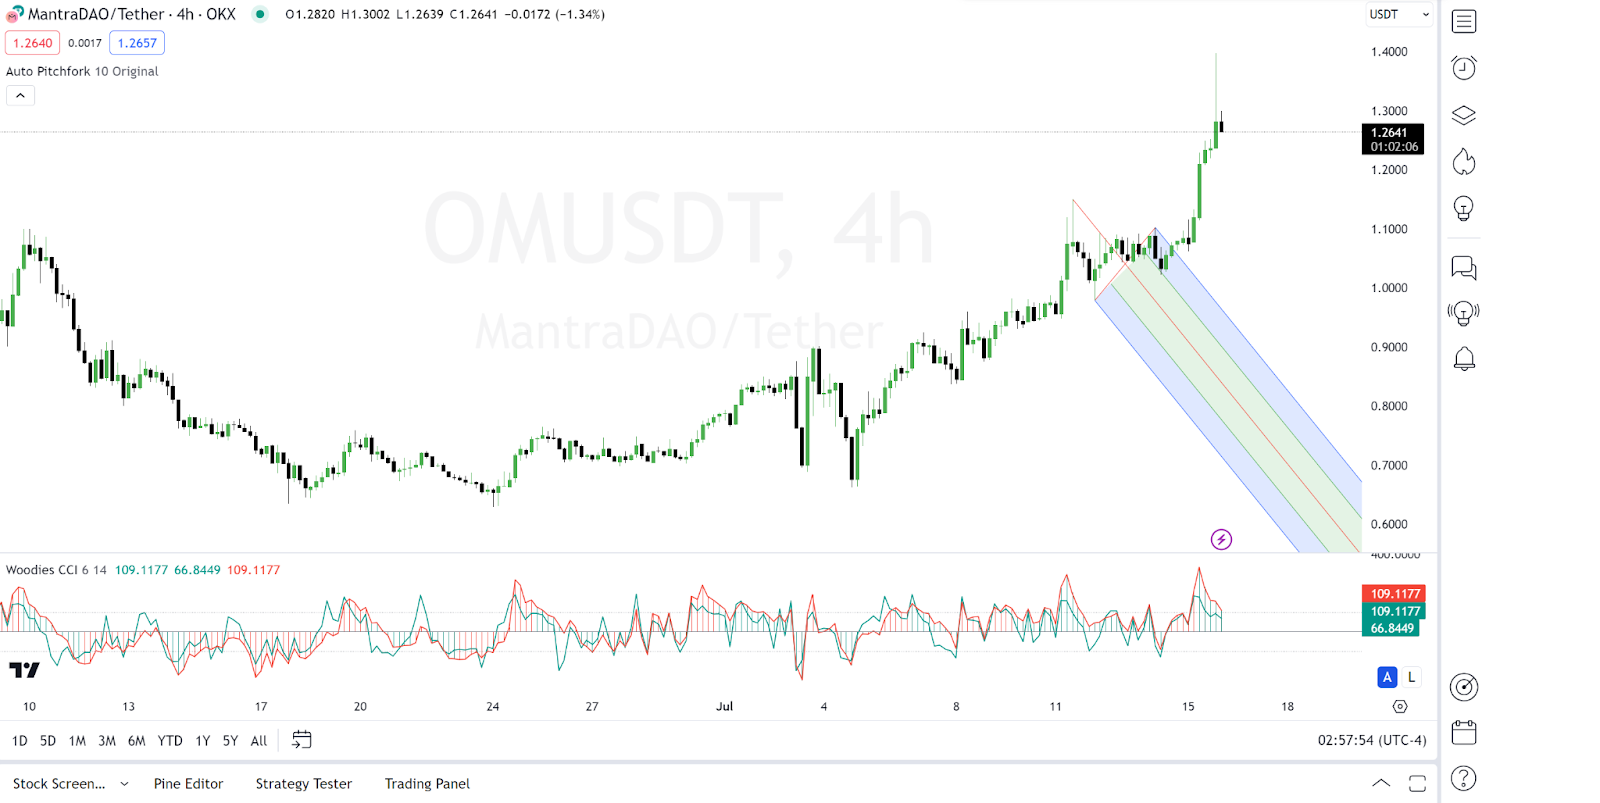
MANTRA Price Review
As the price movements show, Mantra $OM is another top gainer in today’s session. An in-depth analysis shows that the MANTRA price follows an upward pitchfork, indicating a bullish trend channel.
On the other hand, the Woodies CCI is at 109.1177, which is well above 100, indicating strong bullish momentum. As of press time, MANTRA traded at $1.28, representing a 19.75% increase over the last 24 hours.