
Litecoin (LTC) Holders Face Losses Despite Break Above Falling Wedge
 beincrypto.com 16 July 2024 10:53, UTC
 Yesterday, Litecoin (LTC) closed above its falling wedge pattern, signaling a spike in buying pressure. The altcoin had traded within this pattern since March 31.
While this marked a bullish milestone for the altcoin, traders who capitalized on the rally by selling their holdings incurred significant losses.
Litecoin Holders Realize Losses on Investments
An asset trades within a falling wedge pattern when its price trends between two downward-sloping trend lines. The upper trend line acts as a resistance level, while the lower trend line serves as support.
Litecoin began to trend within this pattern on March 31, causing its price to fall to 27% since then. As of this writing, the altcoin exchanged hands at $71.74.
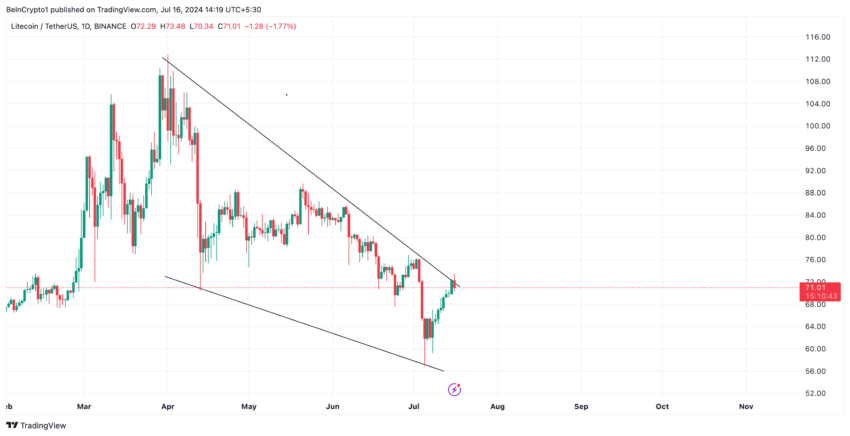
When an asset’s price breaks above the falling wedge, it is a bullish signal. It signals buyers are overpowering sellers and that the price may be poised to trend upwards.
On-chain data revealed that some market participants who capitalized on the breakout to sell their holdings incurred significant losses yesterday.
This is based on the coin’s Network Realized Profit/Loss (NPL) metric readings. Yesterday, the metric dipped to -5.25 million.
Read More: Litecoin: A Complete Guide to What it is And How it Works
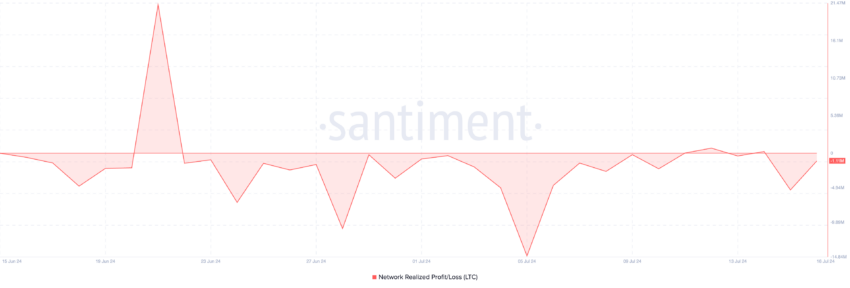
An asset’s NPL tracks whether the holders of an asset across its entire network are selling at a profit or loss.
When this metric’s value dips like this, it indicates that, on average, holders are realizing losses on their investments. This suggests a bearish market sentiment, as traders are panic selling and experiencing capitulation.
LTC Price Prediction: Price Rally May Not Be Sustainable
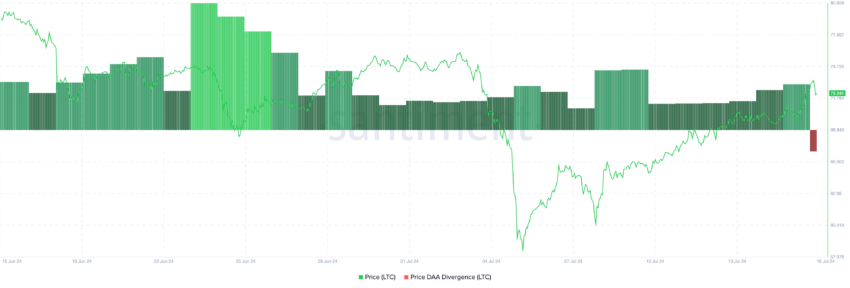
An assessment of LTC’s Price-Daily Active Address (DAA) Divergence metric suggests that the recent uptick in the altcoin’s value might be short-lived.
This metric compares an asset’s price movements with the changes in its number of daily active addresses. Investors use it to track whether the price movements are supported by corresponding network activity.
At press time, LTC’s Price DAA Divergence is negative at -36.78. This showed that the coin’s price is growing faster than its DAA. This signals that the price rise might be due to speculation or short-term buying, not necessarily increased adoption or long-term investor interest. This puts it at risk of shedding its most recent gains.
If this happens, LTC’s value could decline to $70 at the 0.236 Fibonacci retracement level.
Read More: How To Buy Litecoin (LTC) and Everything You Need To Know
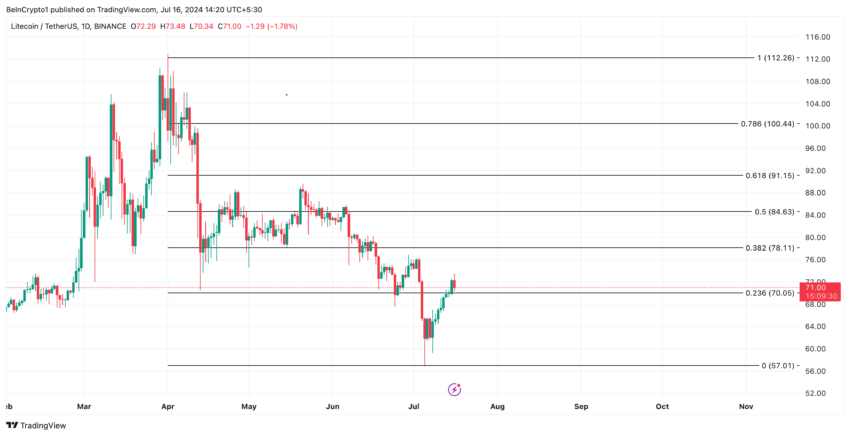
It may continue its upward climb to then trade at $78.11 if the current trend persists.


