
Market Veteran Sees This Altcoin Surging 300% Amid Bull Flag Pattern
 thecryptobasic.com 16 July 2024 17:13, UTC
 Veteran analyst Ali Martinez identifies a bull flag setup in the BRETT/USDT pair, predicting a potential surge of 300% that could push the price to a new all-time high.
Martinez’s analysis comes as BRETT looks to ride on the ongoing market rebound to reclaim lost grounds. The meme coin has recouped some losses amid a 20.57% spike yesterday but remains 30% below its ATH. Martinez cited a bull flag pattern forming on the BRETT daily chart as the basis for his conviction.
Bull Flag Could Lead to New ATH at $0.63
The bull flag pattern is a strong bullish continuation signal. It consists of two parts: a sharp upward move (flagpole) and a consolidation period with downward-sloping trendlines (flag).
In BRETT’s case, the flagpole formed during a steep rise from mid-May to early June. On the other hand, the flag comprises a downward-sloping channel formed from mid-June till now. This channel is due to a massive correction from the June highs.
According to Martinez, BRETT could experience significant price movement if it sustains a close above $0.15. He suggests that this breakout could propel BRETT to a new all-time high of $0.63, representing a 300% increase from current prices.
Martinez’s chart shows several key Fibonacci retracement and extension levels, crucial for identifying potential support and resistance areas. Notably, these levels range from lower levels, such as $0.046442 and $0.061155, to higher critical points like $0.130956 and $0.196013.
The potential price targets based on Fibonacci extensions suggest that if the bull flag pattern plays out, BRETT could reach levels around $0.327276. Other targets include $0.427698 and even $0.628211. Martinez believes a breakout above $0.15 would be a critical indicator of future price movement. Such a breakout would confirm the bull flag pattern.
BRETT Current Market Conditions
Meanwhile, BRETT currently trades for $0.13880 at the reporting time. The current price action is supported by various technical indicators, including the Ichimoku Cloud and the Aroon Indicator.
The Ichimoku Cloud helps gauge momentum and trend direction. Key components for BRETT include the Conversion Line (Tenkan-sen) at $0.13576, the Base Line (Kijun-sen) at $0.13880, and the Leading Span A (Senkou Span A) and B (Senkou Span B) respectively at $0.13037 and $0.13006.
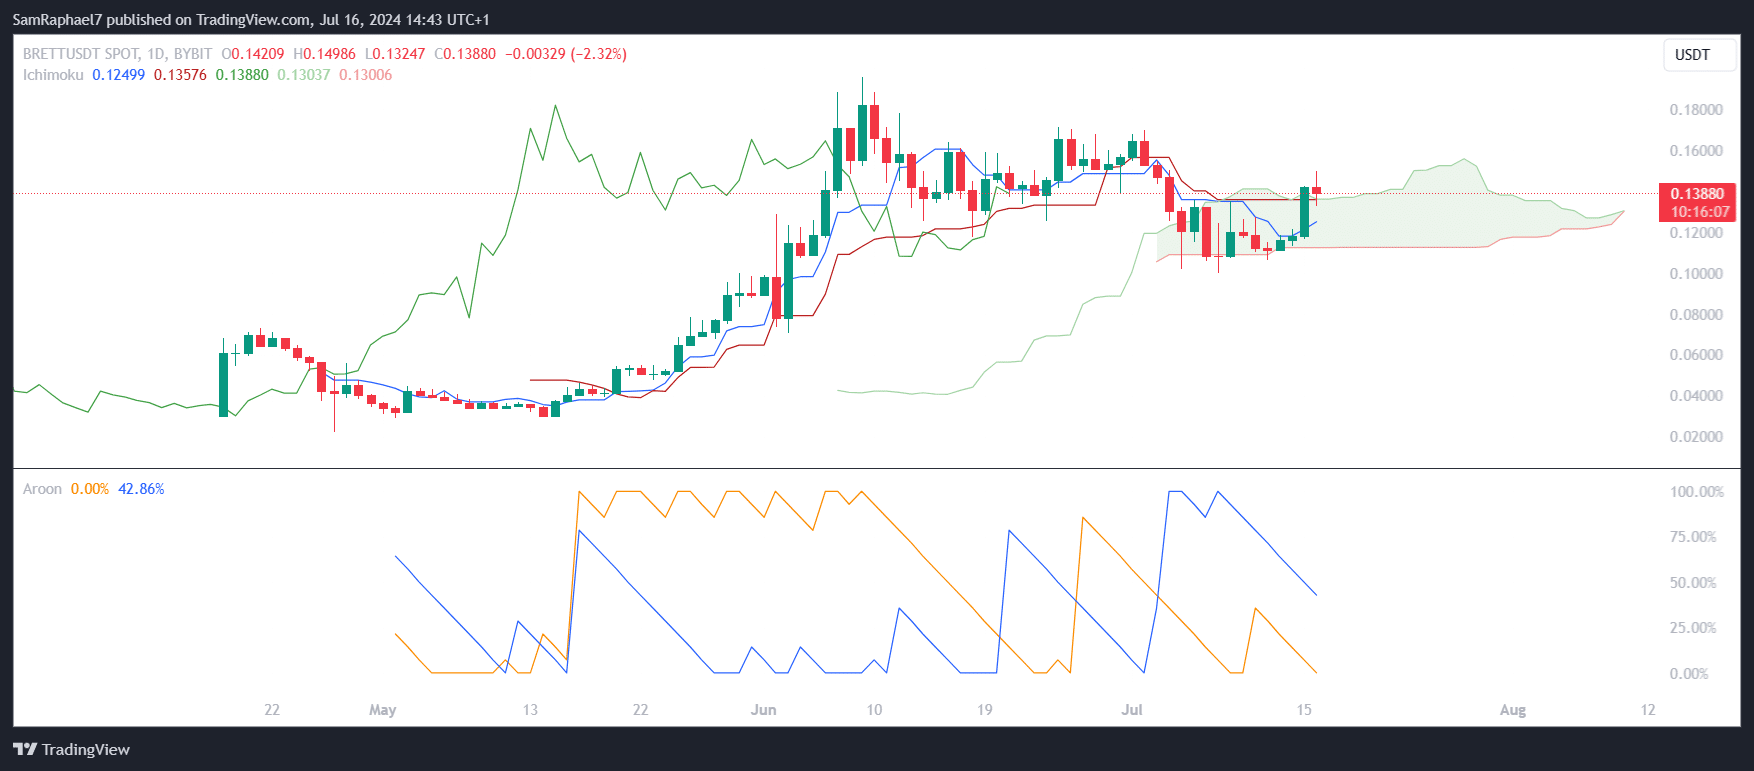
BRETT is trading near the Base Line (Kijun-sen), indicating a neutral position within the Ichimoku Cloud. A break above the cloud could signal a bullish trend continuation, aligning with Martinez’s bullish outlook.
Also, the Aroon Indicator shows an Aroon Up reading of 0.00% and an Aroon Down reading of 42.86%. The Aroon Up indicates how many days since a 25-day high. Meanwhile, the Aroon Down measures days since a 25-day low. The current reading suggests a bearish trend, as the Aroon Down is significantly higher than the Aroon Up.


