Shiba Inu to Surge 855% as Hidden Bullish Divergence Signals Massive Rise
 thecryptobasic.com 17 July 2024 08:51, UTC
 Market analyst Javon Marks believes Shiba Inu could reclaim its all-time high in an upcoming uptrend, identifying a hidden bullish divergence.
Marks, who accurately forecasted SHIB’s rally to $0.000045 earlier this year, now projects an even more significant upsurge. He suggests that SHIB could potentially reach new heights. The latest analysis cites promising technical indicators and favorable market conditions.
The Initial Shiba Inu Analysis
Notably, Marks shared his initial analysis in February, when Shiba Inu traded for $0.00001017. He pointed out a breakout pattern that he believed would lead to a substantial price surge.
This prediction materialized, with prices spiking to $0.000045, a considerable move, albeit not hitting his highest target. His analysis identified a breakout from a downtrend channel, a crucial indicator.
The chart at the time showed Shiba Inu breaking out of this downtrend channel, which was marked by significant resistance levels. This breakout pattern mirrored previous instances where SHIB experienced large price increases.
SHIB Targets $0.0000886
Marks’ recent report continues to indicate strong potential for another significant price increase. According to the latest chart, SHIB is poised for a breakout that could propel it to new highs. This analysis draws attention to the presence of a hidden bullish divergence.
$SHIB (#Shiba)’s 3D prices, despite its recent action, are continuing to hold broken out of pattern that resembles fairly closely, another pattern that sparked a massive run to new All Time Highs.
With prices again going through this similar pattern, we can watch for, in similar… https://t.co/rpOib7qmmC pic.twitter.com/gtBoAHyBXe
— JAVON⚡️MARKS (@JavonTM1) February 7, 2024
A hidden bullish divergence occurs when the oscillator, in this case, the RSI, forms lower lows while prices form higher lows. This pattern suggests that despite lower lows in the RSI, the underlying strength of the price action remains strong.
Despite Shiba Inu giving up the gains from the previous rally, Marks expects a return to the early March highs. According to him, a similar uptrend is on the horizon. The analyst sets an 855% upsurge to a massive $0.000088598 price. This figure would translate to a new ATH for Shiba Inu.
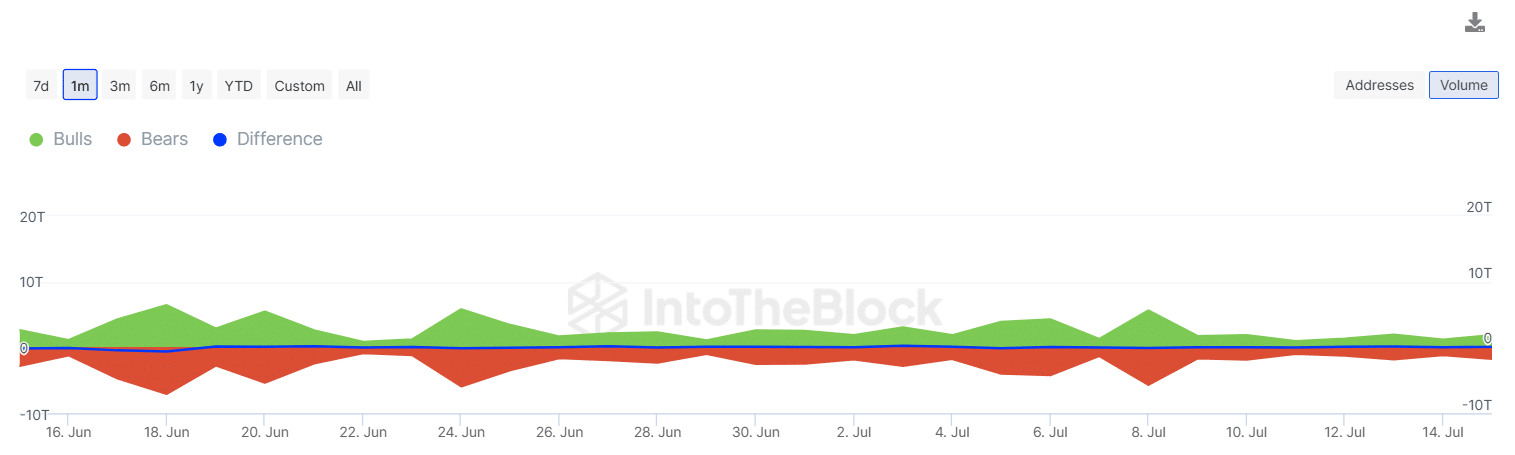
Interestingly, IntoTheBlock shows SHIB is experiencing large whale buys, a trend it could leverage to aim for this target. Data confirms that bulls have purchased 10.78 trillion SHIB over the past week, indicating increased demand.
Shiba Inu Current Position
Meanwhile, Shiba Inu currently trades at $0.00001963, showing a 1.66% increase this morning. This price level represents a 55% gain from the July 5 low of $0.00001266. Another critical indicator, the Money Flow Index (MFI), has risen since July 9 and now stands at 59.1, a high not seen since May.
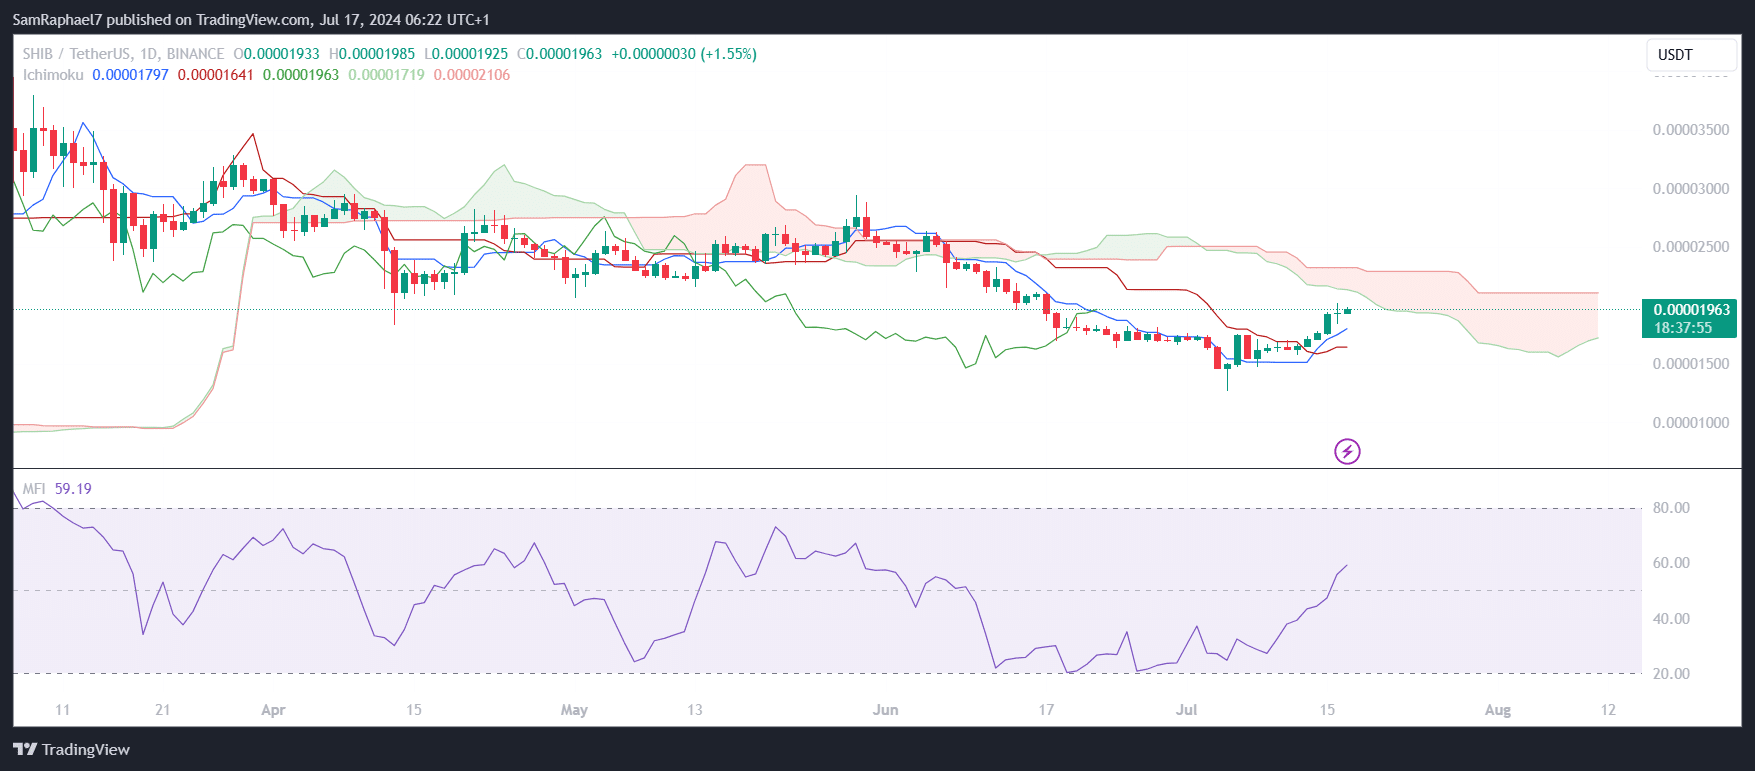
The Money Flow Index is an indicator that measures the inflow and outflow of money into an asset. An increasing MFI suggests that more money is flowing into SHIB, indicating buying pressure. A high MFI typically signals strong market momentum, supporting the potential for further price increases.
In addition to the MFI, the Ichimoku Cloud sends promising signals. The Conversion Line is at $0.00002642, and the Base Line stands at $0.00002551. The Lagging Span is currently on $0.00001704, with Lagging Span A at $0.00002904 and Lagging Span B at $0.00002749.
These figures indicate that SHIB is trading below key resistance levels, but the overall trend remains bullish. The Conversion Line and Base Line suggest short-term support, while the positions of Lagging Spans A and B indicate potential upward movement.


