XRP Dominance Retests Key 1.03% Level, Predicting Surge to $403.78
 thecryptobasic.com 18 July 2024 09:33, UTC
 JD, a prominent market analyst, has predicted a potential price explosion for XRP following a crucial retest of its market dominance level at 1.03%.
This prediction comes amid growing interest in XRP and renewed optimism in the cryptocurrency market. Notably, the XRP dominance chart measures XRP’s market cap position in comparison to the overall market. When XRP price rises, its market cap also surges, leading to increased dominance.
XRP Dominance Retests 1.03%
In his analysis, JD pointed out that the last time XRP dominance tested the 1.03% level, it resulted in an astonishing 650x price increase. This historical data forms the basis of the current bullish outlook.
#XRP – Last time XRP.D tested 1.03%, it 650x! We just retested 1.03% & bounced off it!
Ignore all Riddles/partnership nonsense from influencers that keeps REKTin you!
I called bottom, I’m calling TOP next!
Retweet/Like for updates after close!#DoNotKnowWhatYouHoldLOL!!… pic.twitter.com/WGVwLjgIrt— JD (@jaydee_757) July 16, 2024
The accompanying chart shows that XRP dominance peaked at around 18% in early 2018, followed by significant price spikes. These spikes include a jump to $0.39 (39x in 56 days) and a surge to $3.31 (17x in 28 days).
However, the chart also highlights a notable crash, where XRP dominance dropped by 50% to 0.19% over 203 days. The crash was a product of XRP’s correction from the $3.31 all-time high in January 2018. XRP has since continued to lose its market cap dominance, and it is now the sixth-largest asset by valuation.
The recent activity shows XRP dominance, retesting the crucial 1.03% level and bouncing off it. This retest is significant, as it mirrors the conditions that led to the previous 650x price surge. Interestingly, the 1.03% level has proven to be a critical support level, having been tested multiple times.
Despite JD choosing not to provide a price target for his analysis, a repetition of the 650x increase could lead to greater heights for XRP. This 650x rise from the current price of $0.6212 would lead to an ambitious $403.78.
The chart also features a long-term descending resistance line, starting from the peak in 2018 and touching several lower highs. This trend line suggests that breaking through this resistance could signal a significant increase in XRP dominance.
XRP Shows Bullish Trend, up 42% in a Week
JD depicts XRP’s potential movements with upward arrows, indicating possible spikes in dominance. If XRP manages to break through the descending trend line, it could lead to substantial gains. Amid this bullish scenario, JD has confidently called the bottom. However, he failed to present any price projection.
Current data on XRP’s price movements further supports the optimistic outlook. XRP currently trades for $0.6212, reflecting a significant 24-hour increase of 7.21%. XRP is also up 42% over the past week. The Ichimoku Cloud shows XRP breaking above the cloud, indicating a potential bullish trend.
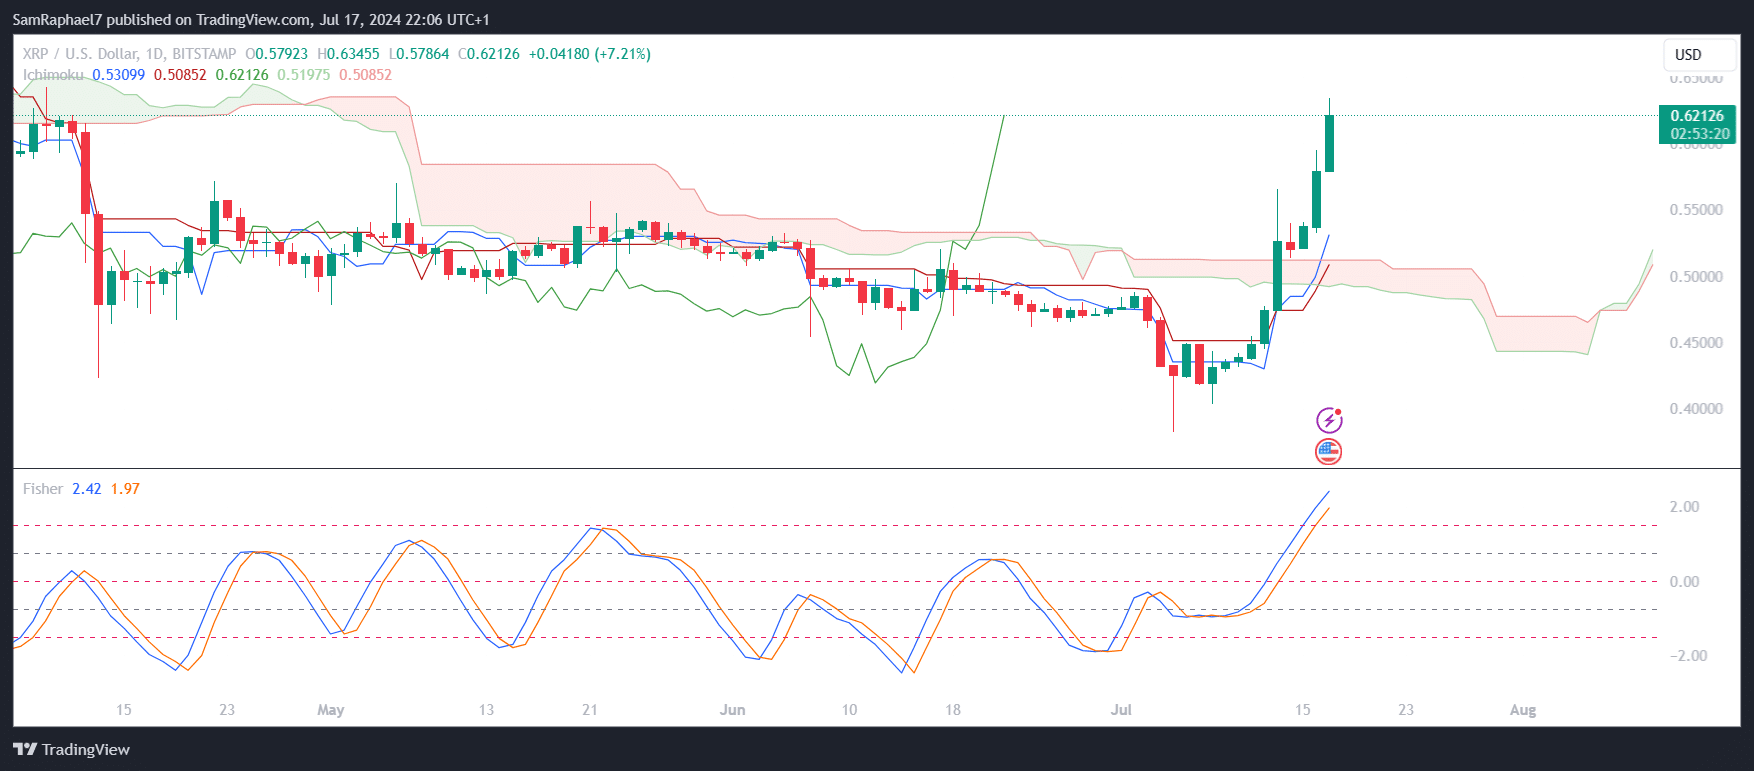
Additionally, the Fisher Transform shows bullish signals. The Fisher Transform value is at 2.42, above the signal line at 1.97. This suggests that the current price momentum is strong and likely to continue in the short term.


