
FET Made Double Bottom Formation: Is a Breakout Underway?
 thecoinrepublic.com 18 July 2024 13:47, UTC
 FET was on track to recovery and comfortably held gains above the 20-day EMA mark. Besides the recovery, it has made a double bottom formation, and a significant pullback was observed.
However, the lower lows formation and a declining trend were spotted, and sellers decisively secured the 200-day EMA mark zone. Until the FET price surpasses the cluster of $2, the token may continue to ride in a downtrend.
Notably, the Artificial Superintelligence Alliance token has demonstrated a follow-on recovery. Additionally, the buyers have begun accumulating and trying to cross the trendline barrier of $1.60 to sprint ahead.
FET at Press Time
At press time, the FET was trading at $1.52 with an intraday surge of 11.20%, reflecting buying momentum on the chart. It has a monthly return ratio of 2.30% and 40.20% yearly, reflecting short-term consolidation.
The pair of FET/BTC was at 0.0000230 BTC, and the market cap was $3.84 Billion. Analysts are neutral and suggest that the FET price may soon breach its trendline hurdle and reach the $2 mark.
FET Price Action and Indicators Overview
FET has shown a recovery and signals a short-term reversal. However, the bulls need to close above the $1.60 mark for a confirmed pullback.
Its RSI curve showed a positive divergence and reached the midline zone, conveying the bullish momentum on the chart.
$Fet
Finally Breaking Falling Wedge Expecting Massive Bullish Wave Towards $ In Coming Days#Crypto #Fet https://t.co/Lp5PpMdpZi pic.twitter.com/zjB8UYYrMF
— World Of Charts (@WorldOfCharts1) July 17, 2024
Moreover, the Money Flow Index (MFI) noted a rise and trended upward following the price reversal. That means the buying momentum might carry forward, and the token could eventually outpace the decline ahead.
Social Dominance and Active Addresses Data
Despite the price recovery, the online discussions of FET were still flat. Its social dominance curve floated below the midline region, directing the declining interest.
The relative strength curve showed a gigantic rise and approached the overbought trajectory. It implies that the buying pressure supported FET.
However, the active addresses data pointed to the rise, which means the new addresses are looking forward to the surge and eager to play a bounce.
Amidst the rise, a confirmed uptrend could be seen if the buyers successfully crossed the $2 mark.
Network Growth Showed a Dip
The investors’ primary concern is the decline of the network, whose value has swam to the lows of around 200. That led to a loss of interest in the new addresses this week.
Likewise, the velocity curve swims below the midline zone, highlighting the declining trading activity and a reduced frequency.
Is a Pullback Possible?
Per the Data From IntoTheBlock, 59.39% of FET addresses were profitable, while nearly 40% of its holders faced unrealized loss.
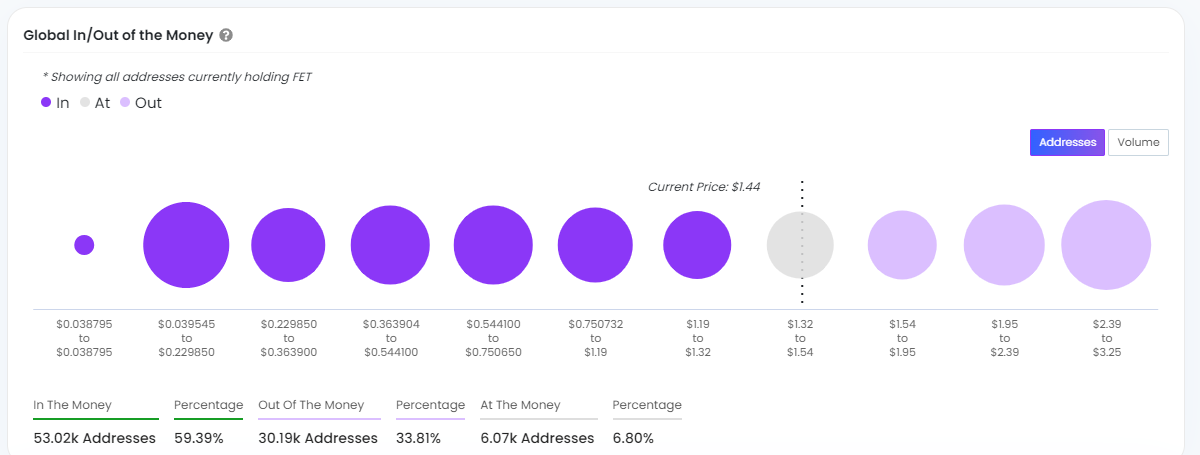
These implications reflected somehow equal weighted data between bulls and bears and could lead to volatile moves ahead.
Any rejection near the $2 mark would impact the token’s strength, and a significant profit booking can also be anticipated.
OI-Weighted Funding Rate
Besides the spot retail traders, the futures and options traders were eager to accumulate FET crypto.
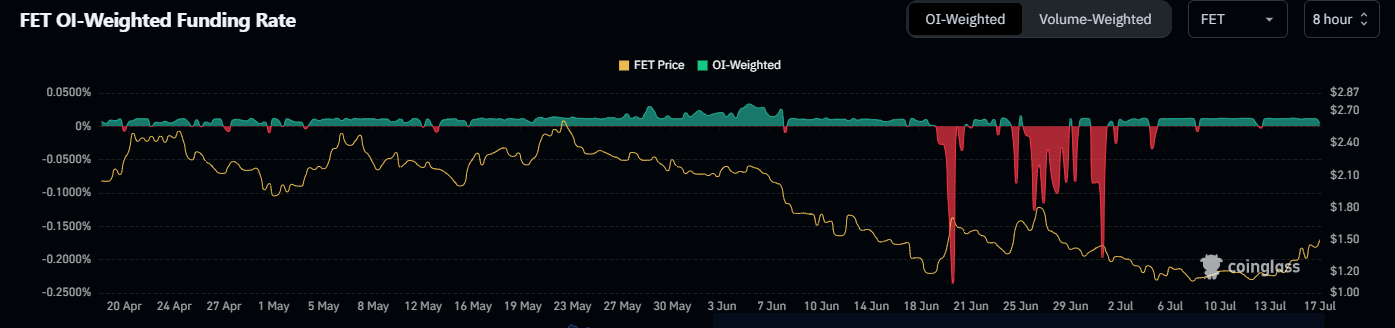
Data from CoinGlass cited that a constant positiveness in the funding rate this week highlighted buyer dominance.
Moreover, its open interest data rose over 10.66% to $44.81 Million, revealing fresh long additions in the past 24 hours.
The immediate support levels for the FET token are $1.20 and $1.10, whereas the key upside hurdle is around $1.80, followed by $2.
What to Expect Next?
The FET token price climbed above the 20-day EMA mark and approached the 50-day EMA mark. Meanwhile, the downward-sloping trendline barrier was on the brink of being crossed by the bulls. Once it breached, a directional move could be seen.


