Cardano DeFi Trading Volume Surpasses $22M: Will ADA Price React
 thecryptobasic.com 18 July 2024 16:27, UTC
 Cardano’s price rebound stalled at $0.44 on July 18, after 40% gains in 14 days; on-chain data analysis explores the bullish and bearish catalysts that have impacted ADA price stagnation in the last 72 hours.
Cardano’s DEX Volumes Soar Amid Mixed Market Signals
Since July 5, Cardano has been on an upward trajectory, mirroring the broader crypto market trends. But after nearly 2-weeks of persistent uptrends, mixed signals have emerged within the Cardano ecosystem as bulls and bears struggle to dominate the next market phase.
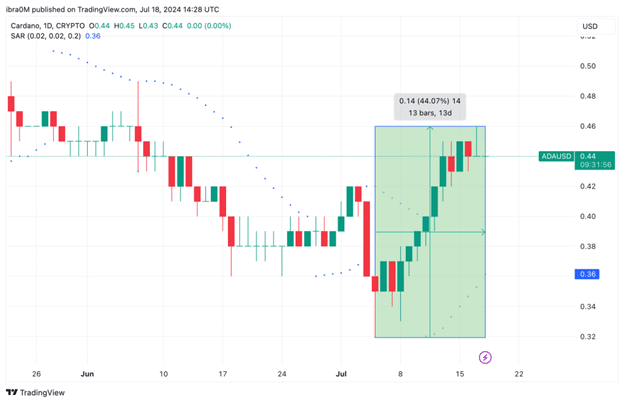
In the last two weeks between July 5 and July 18, ADA prices have increased significantly. The chart above shows how ADA prices had surged 44% from the monthly time frame low recorded on July 5.
However, a closer look at the chart shows that the Cardano price rally has struggled to advance above the $0.45 resistance despite the bullish sentiment surrounding the cryptocurrency sector this week. This rare market alignment suggests that conflicting bullish and bearish catalysts are currently in play within the Cardano markets.
On the positive side, Cardano’s decentralized exchange (DEX) trading volumes have surged significantly, highlighting the growing interest in its DeFi ecosystem. According to recent data, Cardano’s 24-hour trading volume surpassed $350 million, with DEX volumes crossing 50 million ADA this week.
This surge indicates increasing adoption of DeFi applications on the Cardano blockchain, which generally correlates with higher network activity and potentially positive impacts on the network’s health. Despite this uptick in DEX activity, Cardano‘s price has continued to exhibit bearish tendencies. ADA has experienced a notable correction, trading at approximately $0.4493, a 3% decline over the past week.
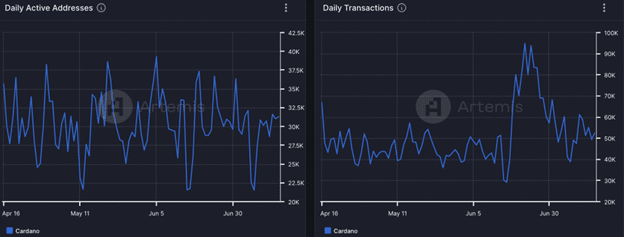
Further analysis reveals a decrease in network activity, with daily active addresses dropping from 39,300 to 31,000 and daily transactions falling from 94,000 to 49,500. These metrics suggest some bearish pressure on ADA, which is reflected in the recent price action.
Despite short-term bearish signals, the long-term outlook remains optimistic. Cardano’s co-founder Charles Hoskinson and other proponents believe in its potential to revolutionize financial markets. Also, speculation about a potential Cardano spot ETF approval could serve as a significant bullish catalyst.
Cardano Price Forecast: Bulls Battling $0.45 Resistance
Cardano (ADA) has shown impressive performance in recent days, with the price climbing from $0.30 to $0.44, representing a 44.07% increase over the past 13 days. This bullish momentum has brought ADA closer to the critical resistance level at $0.45, which it needs to surpass to maintain its upward trajectory.
The chart illustrates a robust bullish trend, supported by a series of higher highs and higher lows. The Parabolic SAR dots below the price indicate a continued bullish sentiment, while the ALMA (Adaptive Moving Average) line is currently at $0.44, acting as a dynamic support level. This suggests that any short-term pullbacks could find support around this level, potentially providing a buying opportunity for traders.
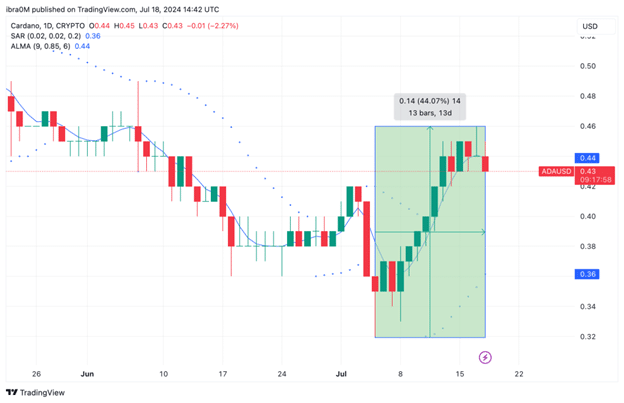
Despite the recent gains, ADA is facing significant resistance at $0.45. Breaking this resistance decisively could pave the way for further upside, targeting the next major resistance level around $0.50. On the downside, the primary support level is at $0.36, as indicated by the Parabolic SAR, which also aligns with a previous consolidation zone. A drop below this level could signal a shift in sentiment, potentially leading to a deeper correction.
The RSI (Relative Strength Index) is at 55.93, which is still below the overbought territory, suggesting there is room for further upward movement. This aligns with the overall bullish outlook, though traders should watch for any signs of RSI divergence that could indicate weakening momentum.
In summary, Cardano’s technical indicators are leaning bullish, with the potential for further gains if the $0.45 resistance is breached.


