
Analyst Expects 300% Gains: Can EOS Manifest A Parabolic Bull Move?
 thecoinrepublic.com 19 July 2024 14:41, UTC
 EOS has become a good performer in recent broader market performance; this showcased resilience and uptrend momentum. According to Coinmarketcap, EOS has recorded 15.08% in the past 7 days, positioning it among the market’s top performers.
BTC showed sustenance over the past two weeks, and the global crypto landscape had a much larger positive effect. During this period, EOS also continued its upward trajectory, achieving a cumulative advancement in its price performance by more than 35%.
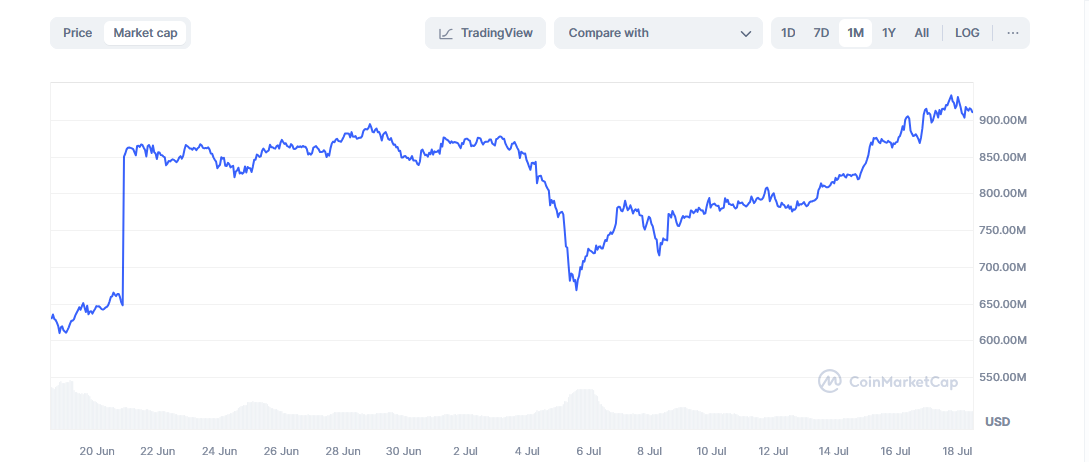
This growth placed EOS at 75th global crypto rank in terms of market cap, where its market cap reached $910.02 Million by July 5th, 2024, from $668.12 Million.
The volume has also grown in a couple of weeks, reaching over $90 Million. However, the EOS price in intraday appears to have slowed slightly, as BTC faced an interruption in its course at the $66150 level. Similarly, EOS’s intraday prices and market cap showed flat activity; 24-hour volume declined 8.37%, amounting to $92.931 million.
Despite the halt, the liquidity appears good, as the volume-to-market cap ratio of the last 24 hours stands at 10.30%. It signified that trading would still be hassle-free for investors and traders (DYOR).
What Does Derivatives Data Analysis Showcase In EOS Coin?
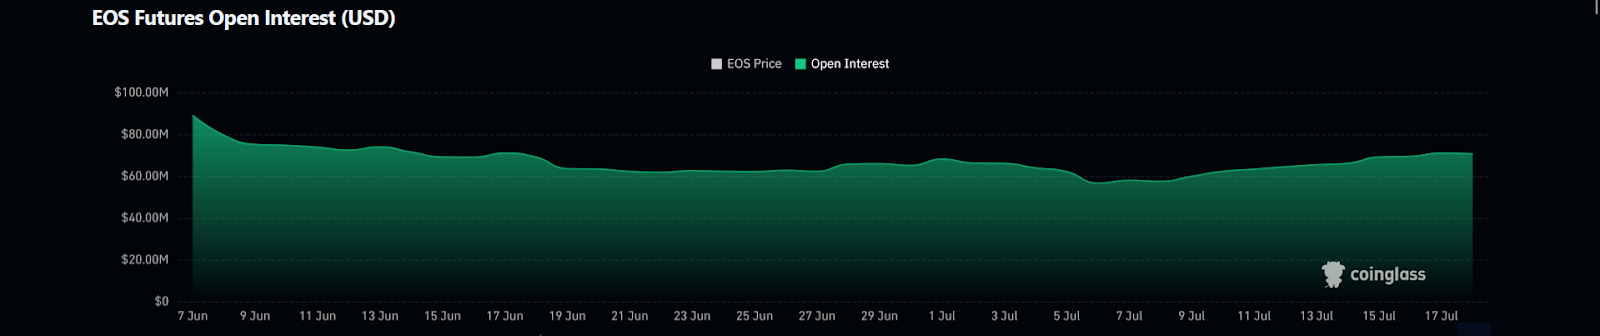
Looking at the halt that BTC took, and the corresponding moments on the EOS open interest, it could imply that early profit takers may have booked profits.
Beyond this, the derivatives’ open interest decline slightly in open interest and derivatives volume, with 2.01% and 3.62%. It amounted to $70.74 Million and $166.72 Million, respectively.
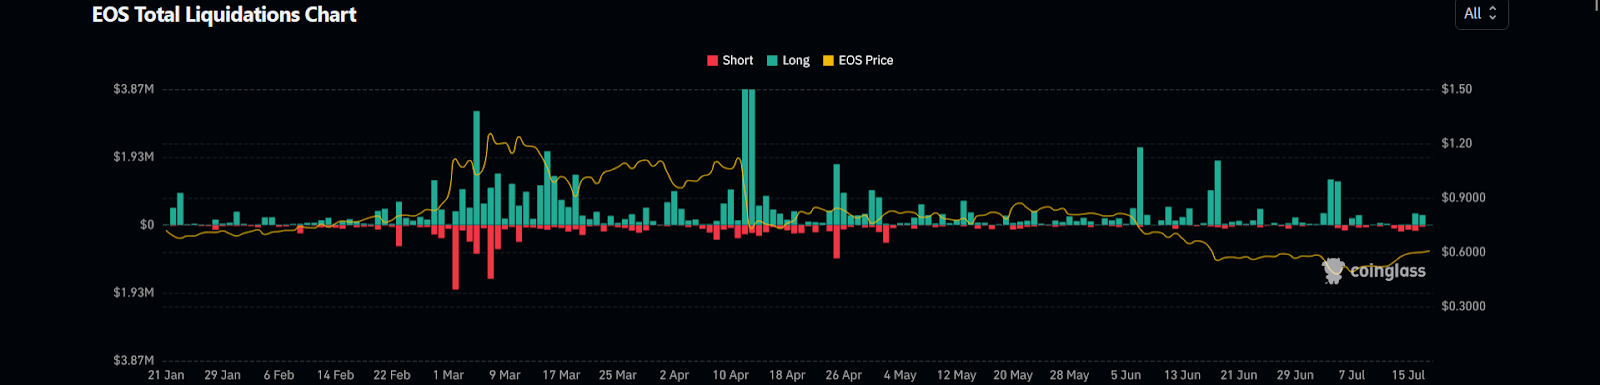
Meanwhile, the liquidation data mostly confirmed suspicions about the reason for the halt. This is because the graph showed two large greens against a few reds in the past 48 hours.
This data signifies that more longs were liquidated than shorts, and as of writing, the 24-hour long liquidations amounted to $293.93K. At the same time, shorts only amounted to $51.53K.
Overall, derivatives highlight that some bookers could still take some liquid out, which could extend the halt.
Additionally, contingent on buyers, the halt could end, as well, with continued bull run probability. So, investors and traders should stay cautious (DYOR).
The Top 10 Holders Hold the Most of the Supply in Circulation!
Looking at its tokenomics, the circulation in people’s hands is 1.502 Million EOS out of a total of 2.100 Million EOS.
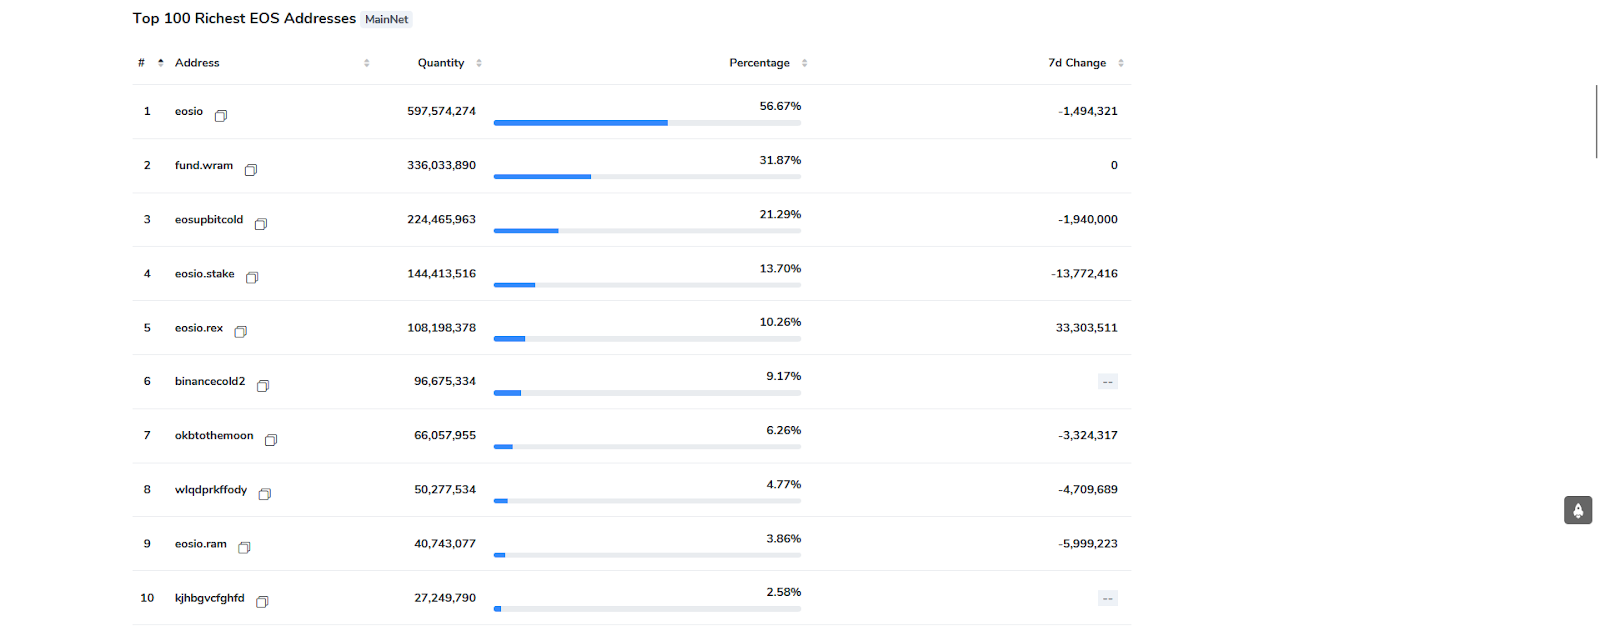
Meanwhile, the total number of EOS holders is 6.253 Million. The top 10 holders’ addresses hold 79.79% of the circulation per the rich list.
Total Value Locked (TVL) and Ecosystem Engagement
TVL indicates the engagement of users and capital commitment within the DeFi platform. Over the past two weeks, there has been a substantial increase from approximately $86.3 Million to over $133.49 Million.
This advancement underscores confidence and active participation among EOS holders and stakeholders. Likewise, it highlights the advancing interest in staking in EOS, liquidity provision, and other TVL-related activities.
Expert Insights On Highlights Greater Market Sentiment!
A market analyst offered perspectives on EOS coin‘s recent performance and prospects. The recent bull run has positioned EOS favorably within the crypto landscape, alluring attention from whales and retailers alike.
$EOS pic.twitter.com/0pliI3IAng
— Old Man Crypto (@OldMannCrypto) July 16, 2024
Similarly, @ OldMannCrypto expressed optimism with his chart in a tweet. He remained cautiously optimistic about EOS’s potential and aimed towards the massive growth up to the $2.50 milestone in the near term.
Thus, this perspective highlights precisely over 300% gains, and to manifest the same on the price chart, it needs massive momentum. So investors should stay cautious before stepping in for big.
EOS Price Chart, Indicators, and its Forecast on Daily Chart!
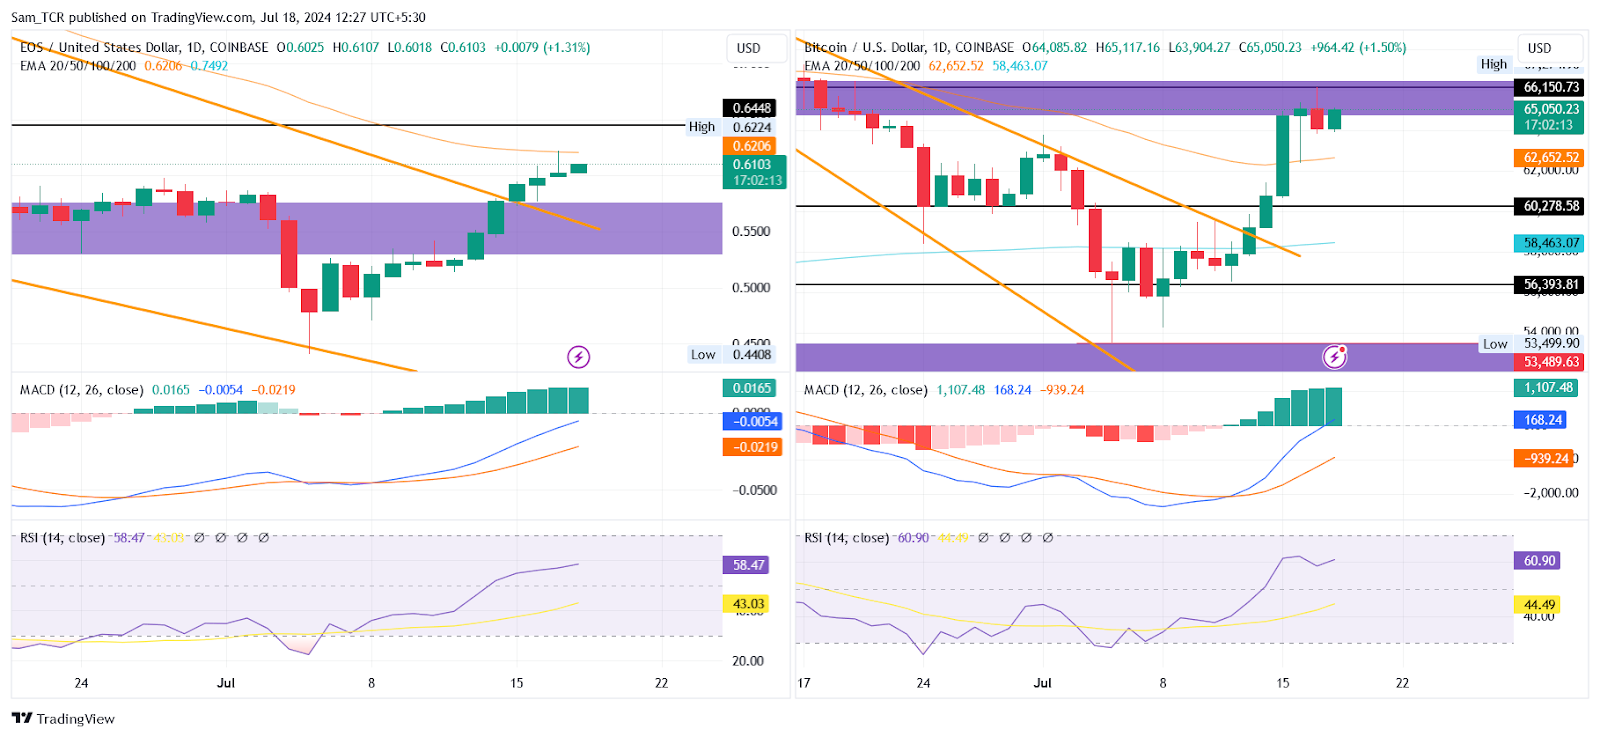
As of writing, in a broader view, EOS breached the narrow declining ranges it followed for a prolonged period. The breakout makes it a bullish pattern, precisely the falling wedge pattern.
The price received significant support from the wedge lower border by July 5th. At that time, the major market had been bullish due to market leader BTC showing sustenance after a great dip. From the lower border, the price got its chance to rise 35%.
EOS halted near the 50-day EMA but once it crosses this mark, it could head toward a 200-day EMA soon. Eventually, both EMA bands would act as hurdles.
Despite the bearish EMAs, the MACD displayed a broad bull cross with a histogram at 0.0160. The RSI moved past the median line, pegging at 56.86. If, in future sessions, EOS rises, the nearest interruptions will be around $0.7250 and $0.9650.
However, if the price dips and returns to the range, the pattern would lose significance while dipping beneath $0.5500. It would take to the lows at $0.4500. EOS surged 15% last week but faced resistance after Bitcoin’s recent stall.
Analysts remain cautiously optimistic about EOS’s potential, with some predicting a rise to $2.50. Technical indicators suggest a bullish breakout, but price action needs to be confirmed.


