
MAGA Token Price Jumps Following Elon Musk’s Support for Donald Trump
 coinedition.com 19 July 2024 11:20, UTC
 Elon Musk’s public support for Donald Trump has reverberated through the crypto community, propelling the MAGA token to the top of trending lists.
As highlighted by Santiment, this newfound attention has boosted the token’s price by a modest 11% since its recent low five hours ago. Meme coins tied to the presidential candidate have exhibited significant volatility, especially following last weekend’s unforeseen events.
Thanks to what the crypto community widely perceives to be Elon Musk’s transparent support of Donald Trump, MAGA is the top trending token in crypto. The price is up a modest +11% since bottoming out 5 hours ago.
Meme coins that are associated with the presidential candidate… pic.twitter.com/msGdcIUfJO
— Santiment (@santimentfeed) July 19, 2024
At the time of writing, the MAGA token is trading at $6.46, down 8.76% over the past day. The market cap is $284,371,179, also down 8.79%. However, trading volume over the last 24 hours has surged by 38.51%, reaching $12,090,224. This spike in volume suggests heightened trading activity, likely fueled by speculators and investors reacting to recent news.
Analyzing the price trend, the MAGA token has been on a downward path from a high of roughly $7.10 to its current price of $6.46. The $6.20 level has acted as a reliable support level, with the price bouncing back multiple times. Similarly, the $6.40 level has also shown signs of support, with the price rebounding after reaching this point.
Conversely, resistance levels at $6.80 and $7.00 are critical. The $6.80 level has been a notable resistance point, where the price struggled to maintain upward movement and subsequently reversed. Moreover, the $7.00 mark serves as a psychological barrier, having been tested but not decisively broken.
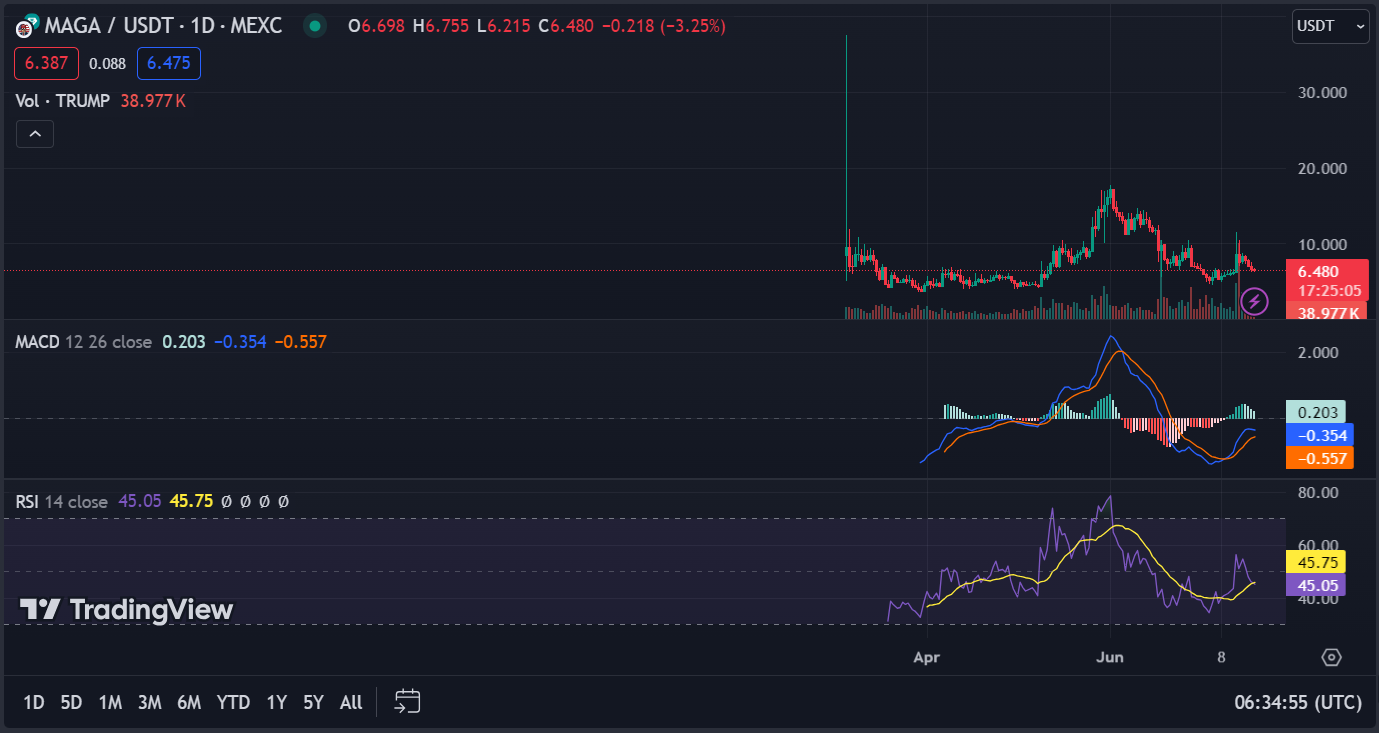
MAGA/USD 1-day price chart, Source: Trading view
The token’s 1-day Relative Strength Index (RSI) reading of 45.43 suggests it is nearing oversold territory. Additionally, the 1-day Moving Average Convergence Divergence (MACD) indicator trading above the signal line indicates potential bullish momentum.
Disclaimer: The information presented in this article is for informational and educational purposes only. The article does not constitute financial advice or advice of any kind. Coin Edition is not responsible for any losses incurred as a result of the utilization of content, products, or services mentioned. Readers are advised to exercise caution before taking any action related to the company.


