Expert Predicts Historic XRP Breakout, Says He’s Never Seen a 7-Year Bull Pennant
 thecryptobasic.com 21 July 2024 18:44, UTC
 MichaelXBT, a market expert and Bitcoin OG investor identifies an unprecedented 7-year XRP bull flag on the quarterly chart and expects an explosive surge.
According to MichaelXBT, this 7-year-old pattern is the longest bull flag he has ever encountered in any crypto asset’s chart. The length of the bull flag indicates that a significant breakout could be imminent for XRP.
XRP Forms Longest Bull Flag in Crypto History
A bull flag typically occurs after an uptrend, indicating a period of consolidation before prices resume the upsurge. The pattern consists of an initial strong upward movement (the flagpole), followed by a series of lower highs and higher lows converging into a pennant.
For XRP, this pattern has been forming for seven years—a duration almost unheard of in the crypto markets. Notably, XRP’s price spiked to an all-time high of $3.31 in January 2018, following an uptrend from February 2017. XRP subsequently faced a retracement. This retracement has persisted until now, leading to the bull flag.
$XRP Historic Breakout Incoming
In all my years of trading crypto I have NEVER seen a 7 year long bull pennant
We might be about to witness one of the most significant breakouts in crypto history pic.twitter.com/X4H5otlcAM
— Crypto Michael (@MichaelXBT) July 17, 2024
MichaelXBT highlighted this formation in his analysis, predicting that the completion of the pattern could lead to one of the most significant breakouts in crypto history. If XRP breaks above the upper trendline of the pennant, a massive upsurge could follow.
XRP Shows Mixed Signals Amid Correction
XRP recently showed signs of a breakout amid the 60% upsurge. However, the token faced a roadblock when it hit a high of $0.6378 on Wednesday. As of now, XRP is trading at approximately $0.5469, reflecting a 4.48% decline this morning.
The Advance Decline Ratio (ADR), which measures the number of advancing prices relative to declining ones, has continued to decline, currently at 0.38. This is due to the recent correction, which has seen XRP collapse 13.47% since yesterday. The lower ADR points to prevalent bearish trends in the short term.
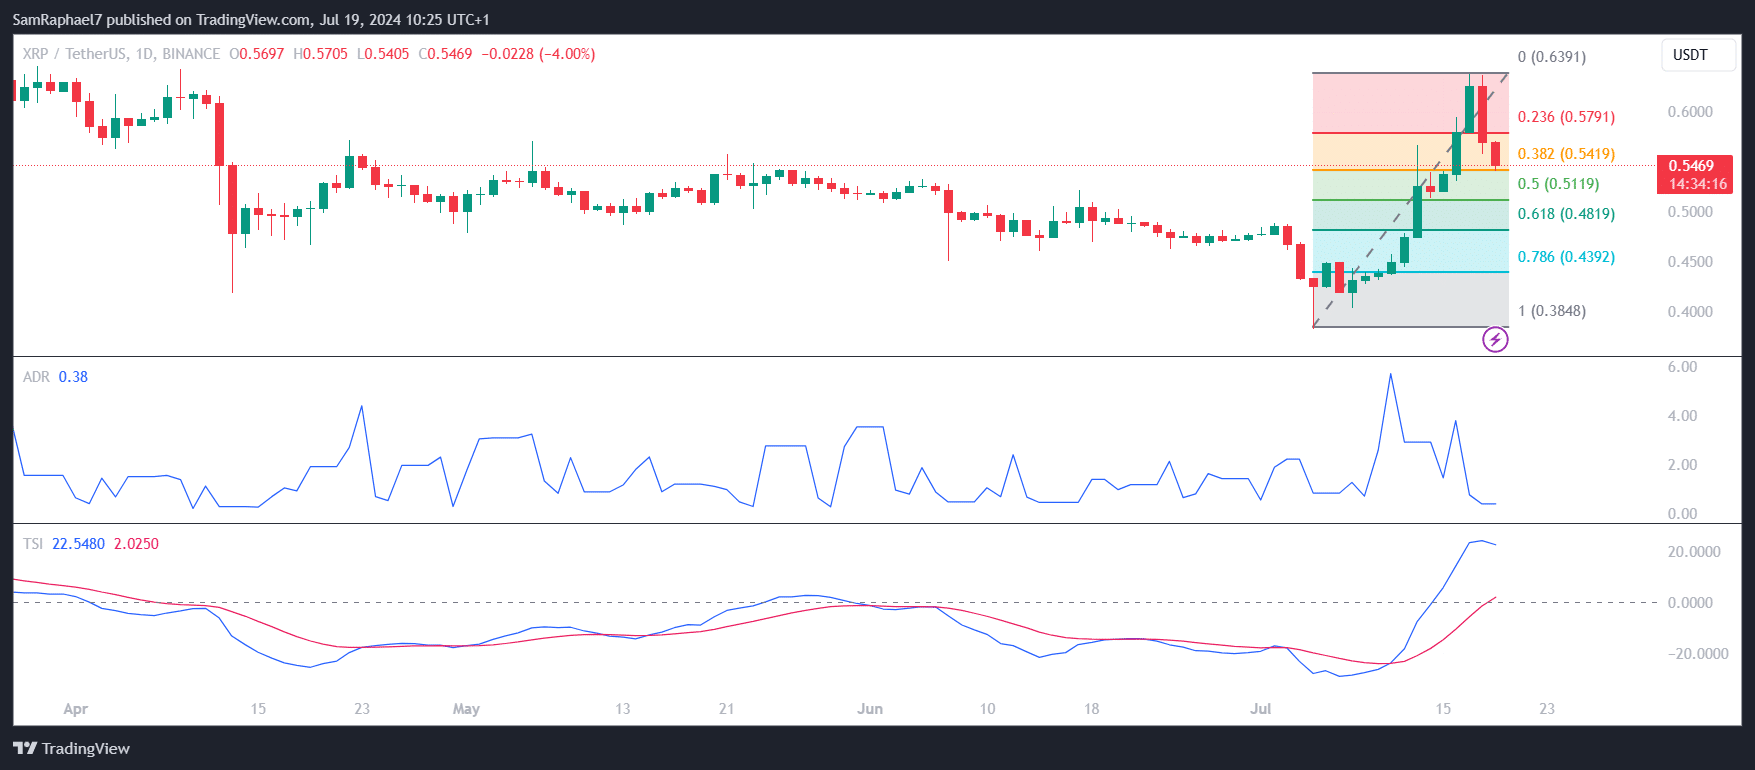
Meanwhile, the Trend Strength Index (TSI) has continued to record a rapid spike alongside its Signal line. Currently, the TSI has increased to 22.54, with the Signal line currently at 2.0250. These figures, along with the increasing trend, indicate strong upward momentum and a strengthening bullish trend in the long term.
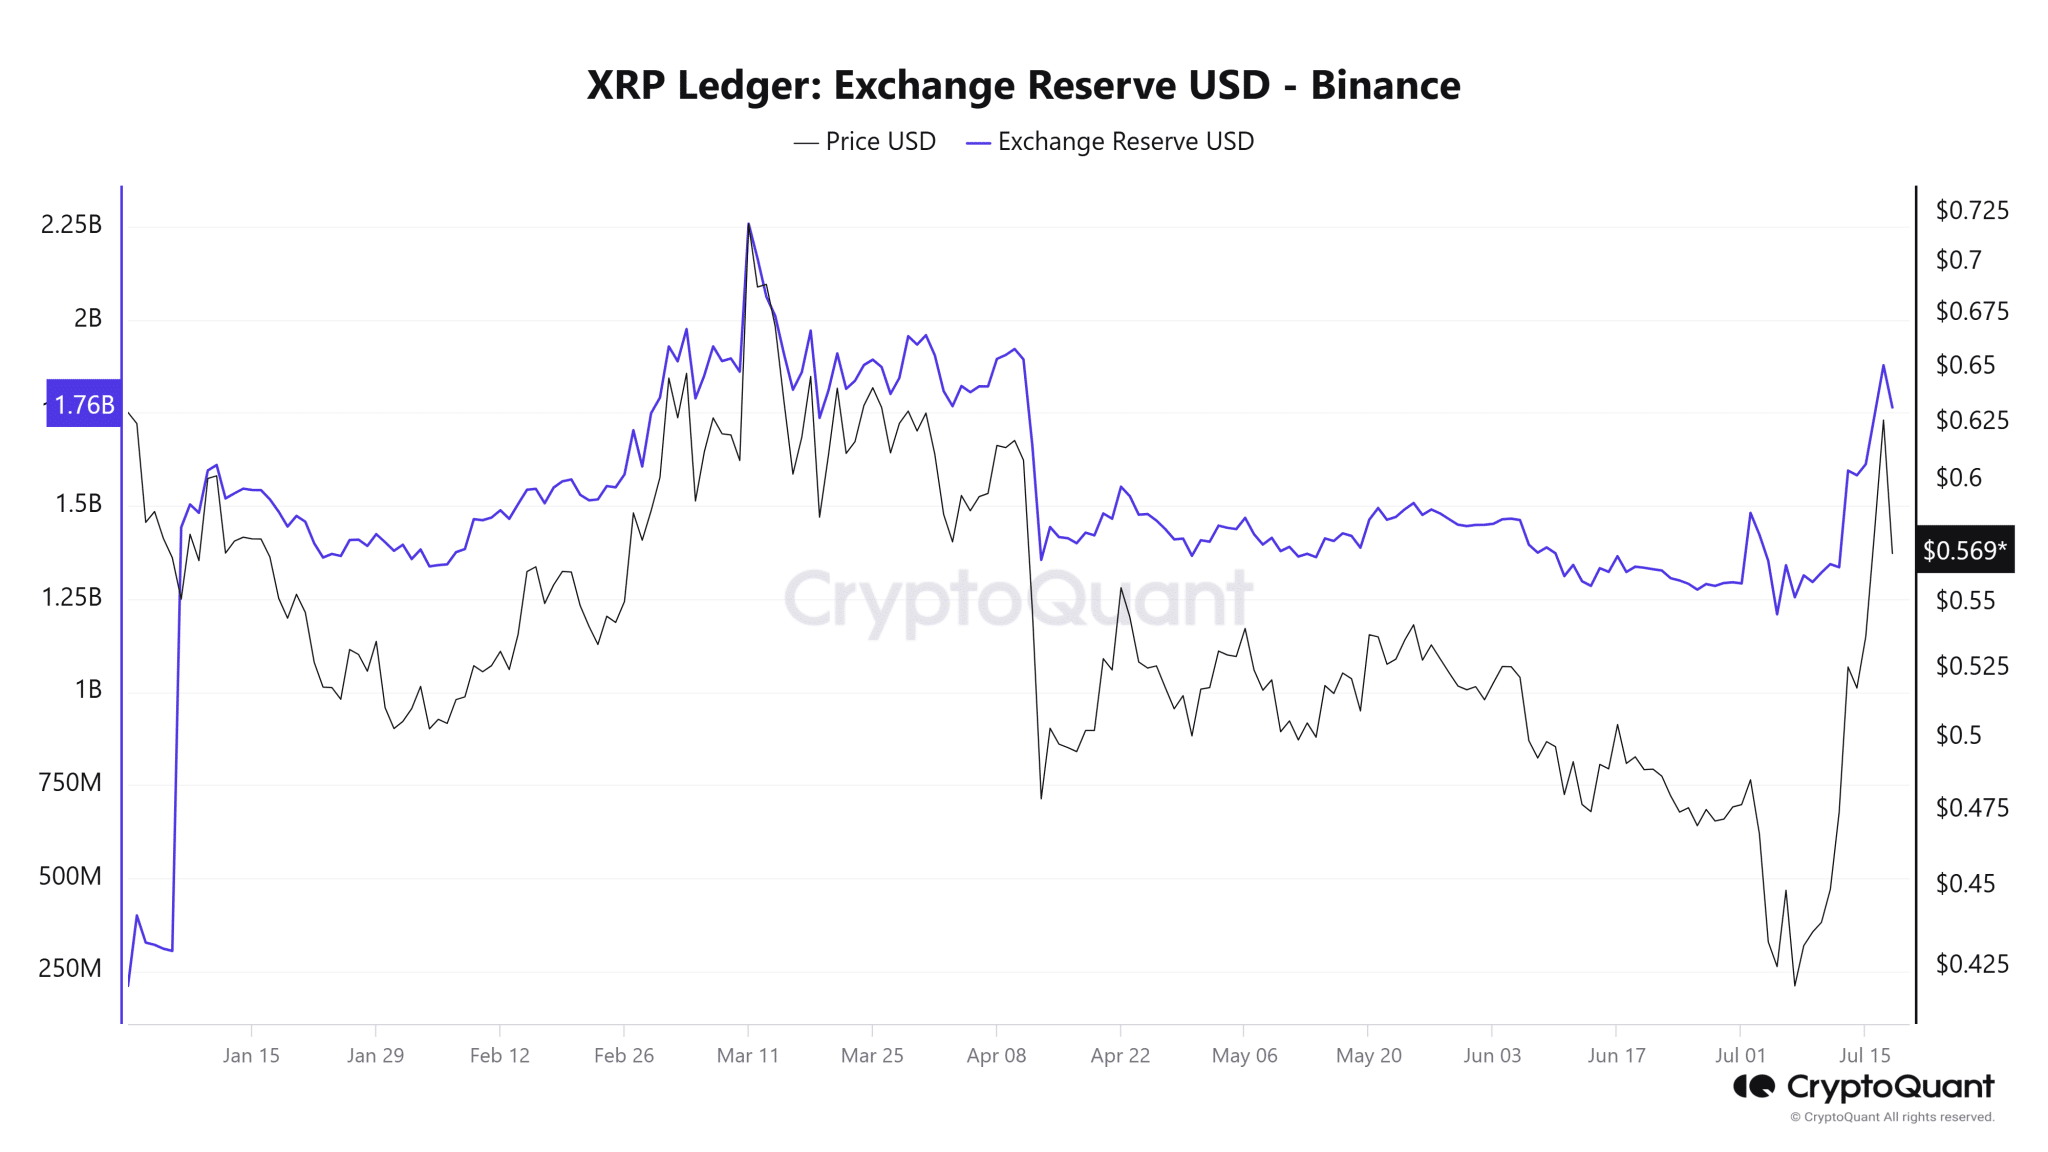
Interestingly, CryptoQuant data shows that the XRP Binance reserve recently surged to $1.87 billion, the highest level since April. Historically, increases in this reserve often occur during uptrends but usually precede corrections. This pattern appears to be playing out as XRP undergoes a correction phase.
Amid the ongoing correction, XRP needs to defend some robust support levels to hedge against more declines. The 38.2% Fibonacci level at $0.5419 is the immediate support, followed by the 0.5 level at $0.5119. If the price dips further, the 0.618 and 0.786 levels at $0.4819 and $0.4392, respectively, will be crucial.


