XRP $30 to $50: XRP Long-Term Fib Levels, Cup and Handle, Elliott Wave All Suggest Big Move
 thecryptobasic.com 22 July 2024 10:14, UTC
 Multiple XRP indicators, including the long-term Fibonacci levels, a cup and handle formation and the Elliott Wave structure suggest a price push to a $30 to $50 range.
Cryptobilbuwoo, a notable crypto market analyst, disclosed this in his latest analysis of XRP’s price movements. The analyst suggested a potential rise to a price between $30 and $50 based on long-term Fibonacci levels, the Cup and Handle pattern, and Elliott Wave theory.
The analysis comes at a time when XRP is currently battling to sustain the ongoing recovery push. XRP eventually reclaimed the $0.60 territory yesterday but faced intense resistance at the $0.6080 high. A breach of this level could trigger an upward push to greater levels.
XRP Targets $30 to $50 Amid Cup n Handle Pattern
Amid this battle with the bears, Cryptobilbuwoo suggested that XRP has the potential to reach two-digit price targets. In a recent X post, he identified a Cup and Handle pattern on the XRP chart.
#xrp #Ripple
1. Long-term Fibonacci ratio 1.618 range ($26.6~33$, overshooting $50).
2. Cup & Handle pattern target ($31) .
3. 3rd wave Fibonacci ratio 3.618~4.236 range ($21~45).
4. Symmetric period based on April 2021 high point: 171 weeks, 7/22
Overnight.♾️ https://t.co/1zOOrNbtrr pic.twitter.com/RCrUwBIfSp
— (X)=chi (R)esurrected (P)=rho (@Cryptobilbuwoo0) June 26, 2024
The Cup and Handle formation is a classic chart pattern that signifies consolidation followed by a breakout. The rounded bottom of the cup indicates a period of accumulation, while the handle represents a smaller consolidation before the price surges.
Data from the accompanying chart suggests that this bullish pattern targets a price level of $31. The target of $31 aligns with the upper end of the Fibonacci extension range. This convergence bolsters XRP’s chances of challenging for this price target. Interestingly, the analyst also identifies the possibility of an overshoot to the $50 price.
XRP Elliott Wave Structure
Also, Cryptobilbuwoo included the Elliott Wave theory in his analysis, focusing on the third wave. The chart indicates that XRP recently concluded the second wave amid the latest price correction. In Elliott Wave theory, the third wave, which XRP is expected to begin, is typically the strongest.
The Fibonacci extensions for the third wave range from 3.618 to 4.236, translating to a price range of $21 to $45. In addition to this, the analyst called attention to the 1.618 Fibonacci extension level in the range of $26.6 to $33. He emphasized the significance of this zone.
Current Price Position
Meanwhile, XRP currently trades for $0.5903, up 1% in the last 24 hours. Over the past few months, XRP has experienced fluctuations, but recent movements indicate a consolidation phase.
The Aroon indicator, used to identify trends and potential reversals, shows a 64.29% level for the Aroon Up line, indicating that upward momentum is building. Meanwhile, the Aroon Down line remains at 0.00%, showing that bearish forces are currently weak.
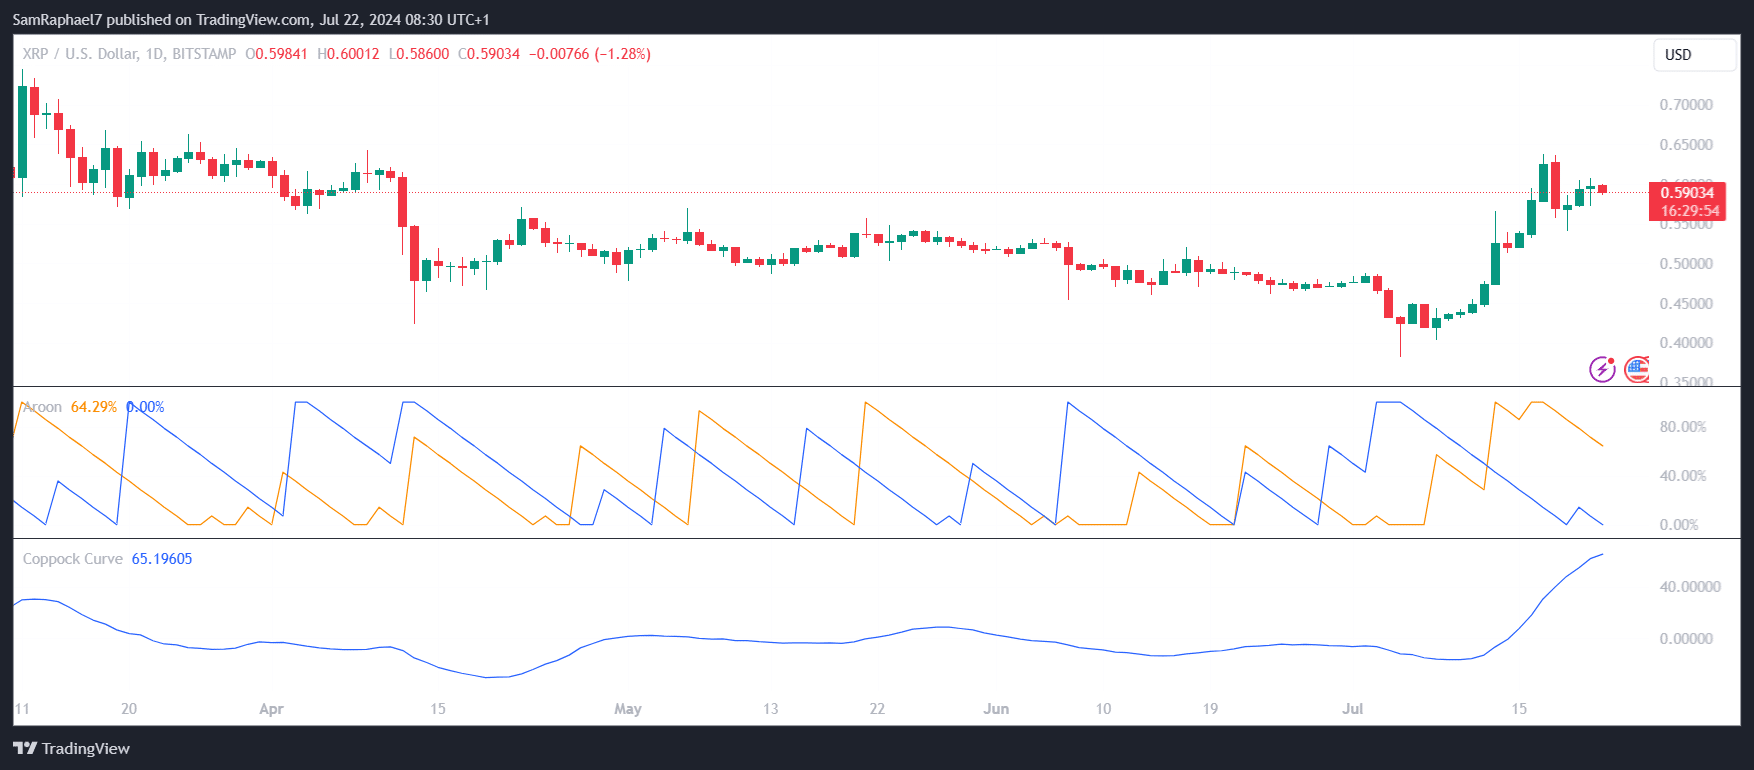
Moreover, the Coppock Curve is trending upwards at 65.196. This rise in the Coppock Curve typically signals the beginning of a new bullish trend. The formation of the Cup and Handle pattern and the transition to the third Elliott Wave could bolster chances of this imminent bullish trend.


