
Bitcoin Technical Analysis: BTC Balances Short-Term Corrections and Long-Term Bullish Momentum
 news.bitcoin.com 22 July 2024 13:41, UTC
 On Monday, bitcoin’s price stands at $67,463 per unit, within an intraday 24-hour range of $65,833 to $68,486. The leading crypto asset boasts an overall market capitalization of $1.33 trillion and a 24-hour trade volume of $31 billion.
Bitcoin
Bitcoin’s 1-hour chart indicates a recent peak at $68,486, followed by a downward correction. The current price action shows a series of lower highs and lower lows, pointing to a short-term downtrend. The most recent low was at $65,833, with a minor rebound that hasn’t yet shown strong upward momentum. Volume spikes are noticeable during significant price movements, suggesting potential for reversals or continuations. Currently, there is lower volume on both upticks and downticks, indicating market consolidation or indecision.
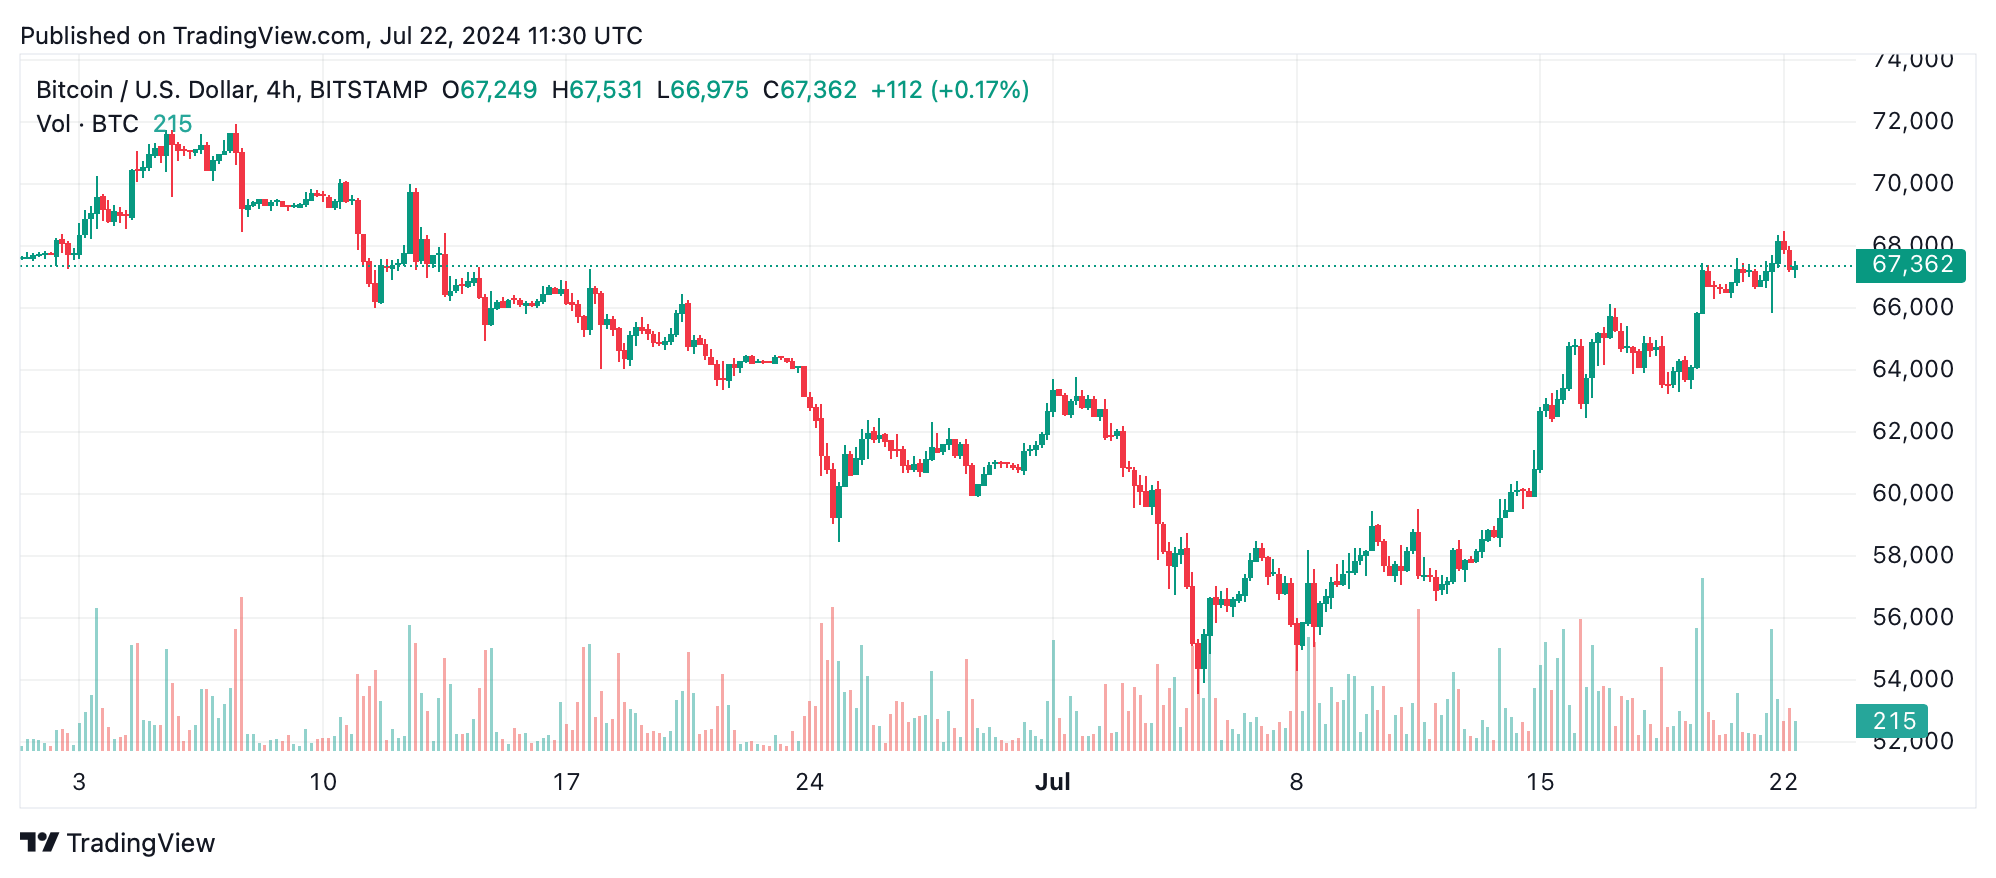
On the 4-hour chart, BTC demonstrates a more pronounced bullish movement leading up to the peak at $68,486. Following this peak, a mild correction occurred without a significant drop, maintaining higher lows. The price is consolidating around the $67,000 to $67,500 range. Volume analysis reveals an increase during the rise to $68,486, followed by lower volume during consolidation, suggesting the market might be preparing for the next significant move.
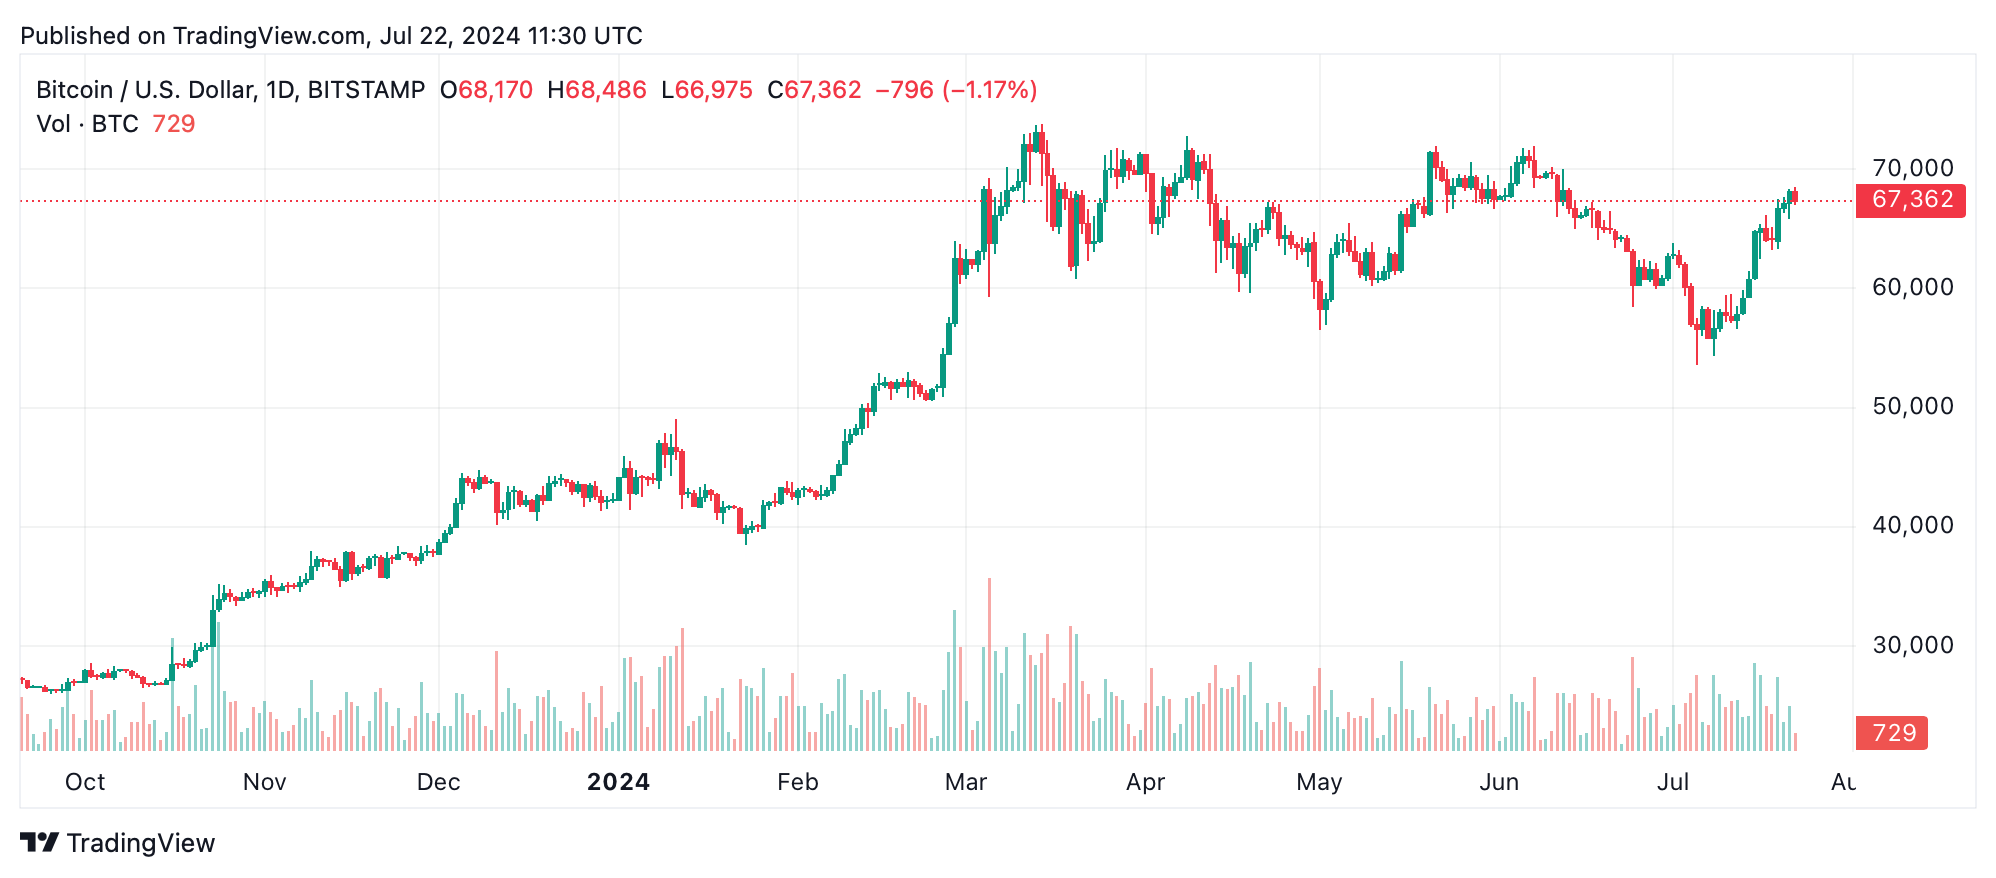
The daily chart shows an overall bullish trend from a low of $53,550, steadily climbing to current levels. Recent patterns indicate consolidation near the top, suggesting a potential pause in the uptrend. Volume analysis during the uptrend indicates strong buying interest, with recent lower volume during consolidation possibly signifying less selling pressure, a positive sign for bulls.
Oscillator readings show a mixed sentiment: the relative strength index (RSI) is neutral at 65, the Stochastic is neutral at 96, and the commodity channel index (CCI) suggests negative sentiment at 122. The momentum oscillator indicates a bearish signal at 9,588, while the moving average convergence divergence (MACD) level suggests a bullish indicator at 1,369. The average directional index (ADX) remains neutral at 30, indicating a lack of strong trend direction.
Moving averages (MAs) on various timeframes consistently indicate a buying sentiment. The 10-day exponential moving average (EMA) and simple moving average (SMA) are both above the current price, signaling buying opportunities. Similarly, the 20-day, 30-day, 50-day, 100-day, and 200-day EMAs and SMAs also suggest strong demand, providing multiple support levels that can be used to gauge entry points during price dips.
Bull Verdict:
Given the alignment of multiple moving averages indicating a strong buying trend and the overall bullish trend observed on the daily chart, the broader outlook for bitcoin remains positive. Entry points on breakouts above key resistance levels or dips around established support suggest the potential for upward movement. Despite mixed signals from oscillators, the volume analysis and consistent higher lows on the 4-hour chart reinforce a bullish sentiment.
Bear Verdict:
Despite the overall bullish trend, short-term indicators such as the 1-hour chart showing lower highs and lows suggest caution. The mixed signals from oscillators and recent consolidation patterns could indicate the potential for a downward correction. Traders should be wary of entry points during this consolidation phase and consider tight stop-loss levels to mitigate risk if the price fails to break above key resistance levels or dips below significant support.


