
FET Shows Major Bullish Signs Amid Market Recovery, $19 Soon
 coinedition.com 23 July 2024 10:02, UTC
 FET, the native token of Artificial Superintelligence Alliance (ASI), is on the path to print remarkable gains as the chart pattern of the altcoin has turned bullish, gaining Fibonacci levels and indicating signs of a potential reversal and higher highs in the near future.
As pointed out by “Wealth Crypto” on social media platform X (formerly known as Twitter), FET is one of the bullish charts in the crypto space and is quite close to the highs achieved by major performing cryptocurrencies in the digital asset sector.
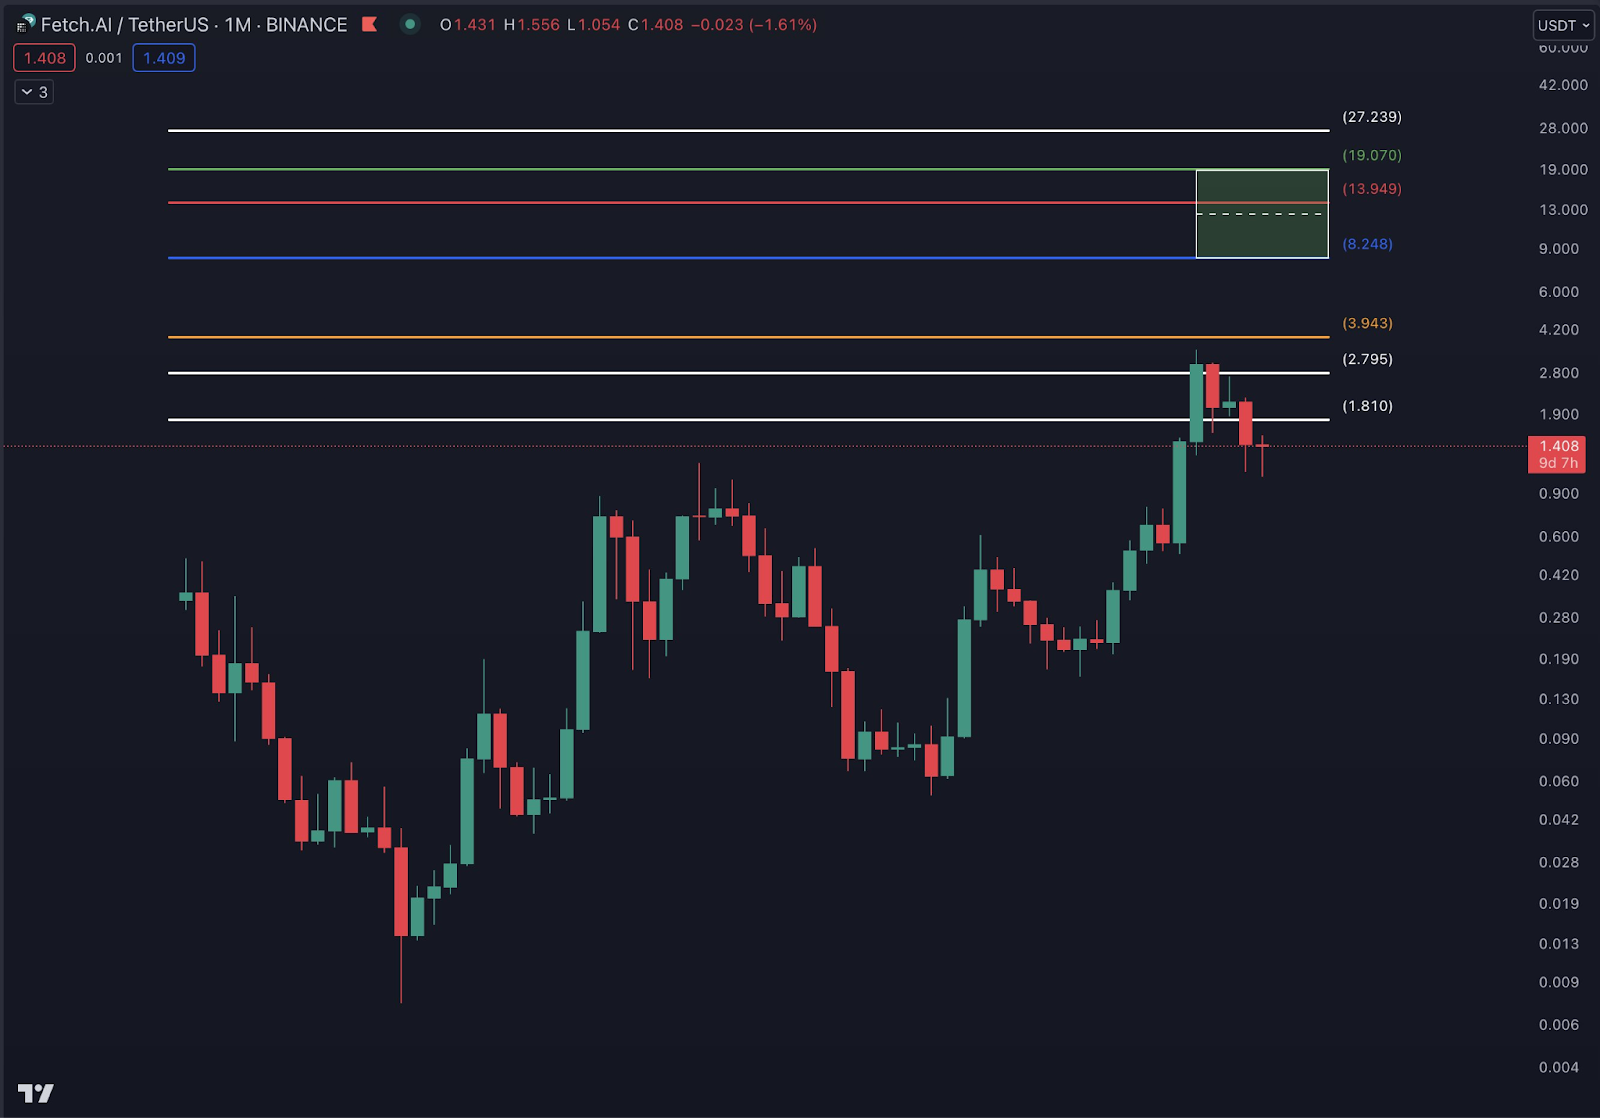
In a chart, the analyst highlighted that FET is “one of the most bullish charts in terms of Fibonacci levels it has gained” and has formed a rising pattern in the short term. These Fibonacci levels indicate that the altcoin might have reached a level where it might find support and that the chances of a reversal are high.
It is important to note that traders use Fibonacci levels to make decisions about entering or exiting trades, and according to Wealth Crypto, FET is expected to reach a price tag between $8 to $19 soon.
On the other hand, the data from CoinMarketCap shows that FET is currently trading at $1.34 and is down by more than 5.5% in the last 24 hours. However, the altcoin is up 505.67% since July 2023 but has shown more subdued price action in the last month, down 8.17% in 30 days.
A major driving force of the FET price action has been the merge of SingularityNET, (AGIX) Fetch.ai (FET), and Ocean Protocol (OCEAN) into the Artificial Superintelligence Alliance (ASI) with FET being the main token. Notably, the multi-coin merger, forming the unified token, was announced on July 1 and the price action might gain traction in the near future as this merger takes into effect.
As per the chart provided by TradingView, the accumulation of the cryptocurrency has gone down in the past few days amid a broader crypto market sell-off. The gradient of the line suggests that the distribution (sell-off) has stabilized.
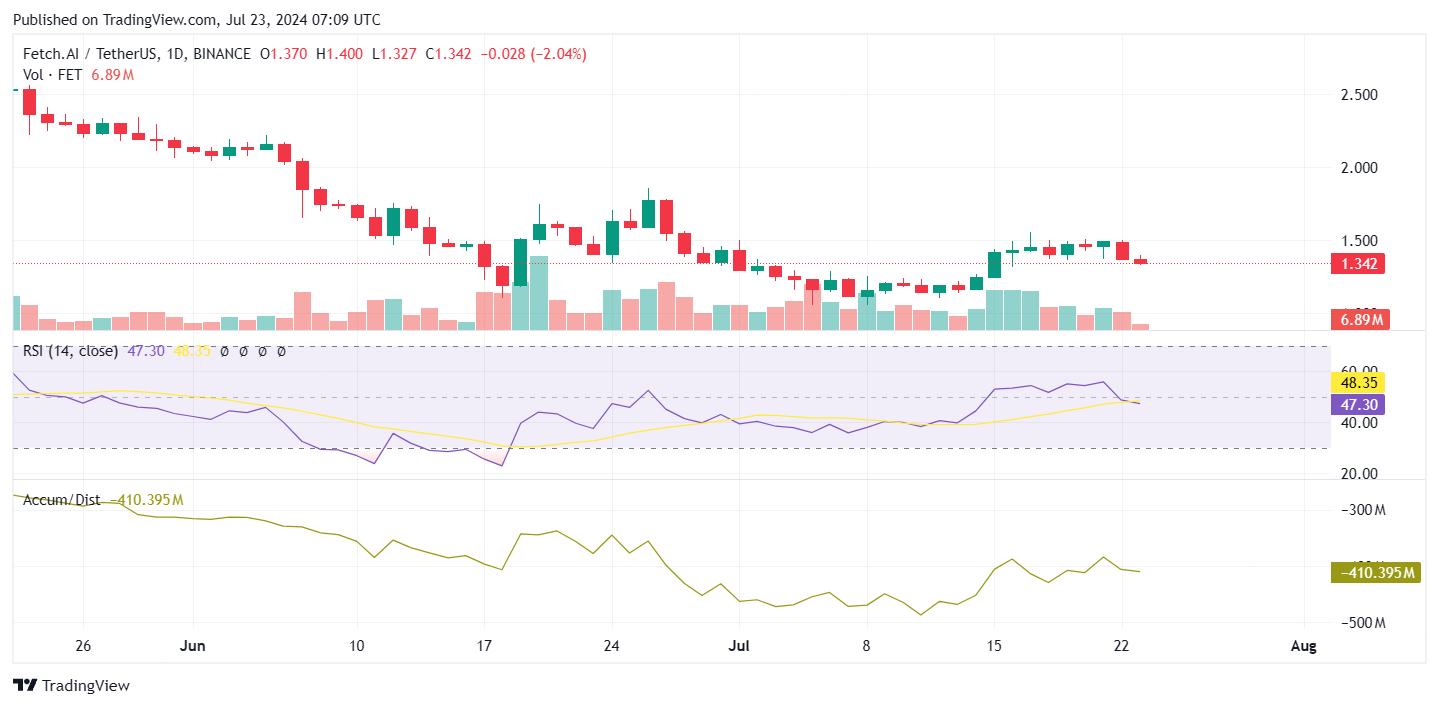
On the other hand, the Relative Strength Index (RSI) has a value of 47.30, suggesting that the bears have taken control from the bulls and might drive prices lower in the short term.
Disclaimer: The information presented in this article is for informational and educational purposes only. The article does not constitute financial advice or advice of any kind. Coin Edition is not responsible for any losses incurred as a result of the utilization of content, products, or services mentioned. Readers are advised to exercise caution before taking any action related to the company.


