Cardano Eyes $5 to $15 Range: Analyst Highlights Multi-Year Bullish Pennant
 thecryptobasic.com 23 July 2024 10:48, UTC
 Two TradingView analysts have identified a Cardano bullish pennant and falling wedge, with one projecting an imminent rally to a range of $5 to $15.
AugustusAsir, one of these analysts, emphasized that Cardano (ADA) is on the cusp of a breakout move. According to him, ADA is forming a massive multi-year bullish pennant. This pattern suggests that a significant price surge could be on the horizon.
Cardano Targets $5-$15 Amid Bullish Pennant
Data from the analyst’s monthly chart confirms that Cardano has traded within a symmetrical triangle setup since September 2021, when it reached the all-time high of $3.1. ADA has corrected from this peak but continues to battle the bears in an attempt to stay up.
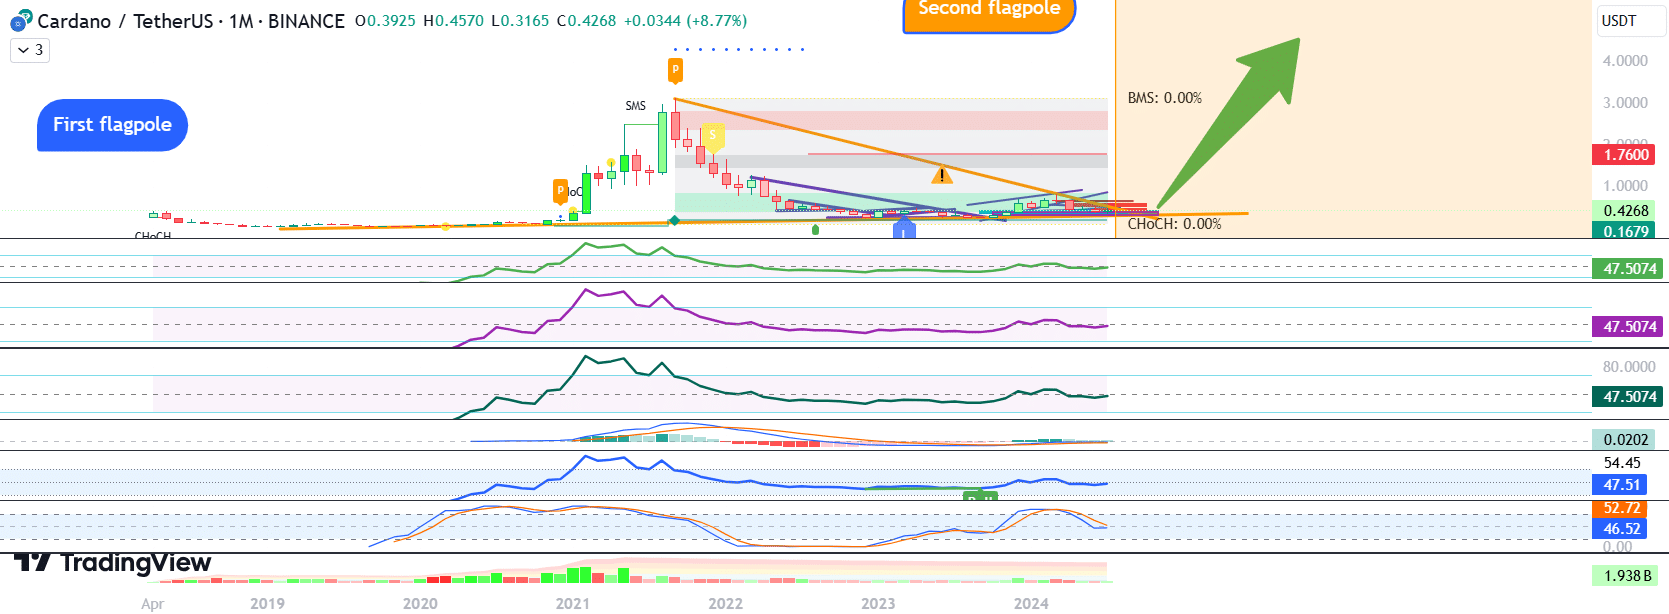
This has led to a consolidation phase, essentially forming the symmetrical triangle pattern. Interestingly, the initial 2021 spike that led to the $3.1 high formed a flagpole structure. Considering this setup, AugustusAsir notes that the symmetrical triangle is part of a broader bullish pennant pattern.
Such a pennant pattern indicates that ADA is witnessing a consolidation before an eventual upsurge. The initial target for this pattern was set at $3.10, a significant resistance level to the 2021 rally. However, the analyst Identifies a second flagpole, which could push prices to a range of $5 to $15.
Several indicators support this optimistic forecast. First, the volume profile shows increasing trading activity, indicating surging interest. Moreover, in the accompanying chart, the RSI and MACD suggest building bullish momentum. The recent spike in DeFi trading volume could also bolster bullish trends.
AugustusAsir also calls attention to a robust support level around $0.1679, with a significant resistance level at $1.7600. These levels will be pivotal in determining Cardano’s price trajectory in the coming months. If ADA can break through the $1.7600 resistance, the path to the $5 to $15 range becomes more plausible.
ADA’s Falling Wedge Pattern
Meanwhile, in a separate report, CobraVanguard, another notable market analyst on TradingView, identified a falling wedge pattern, typically considered a bullish reversal pattern. This pattern’s breakout has already occurred, with Cardano’s price rising to $0.4270, a minor increase that signals the start of a potential rally.
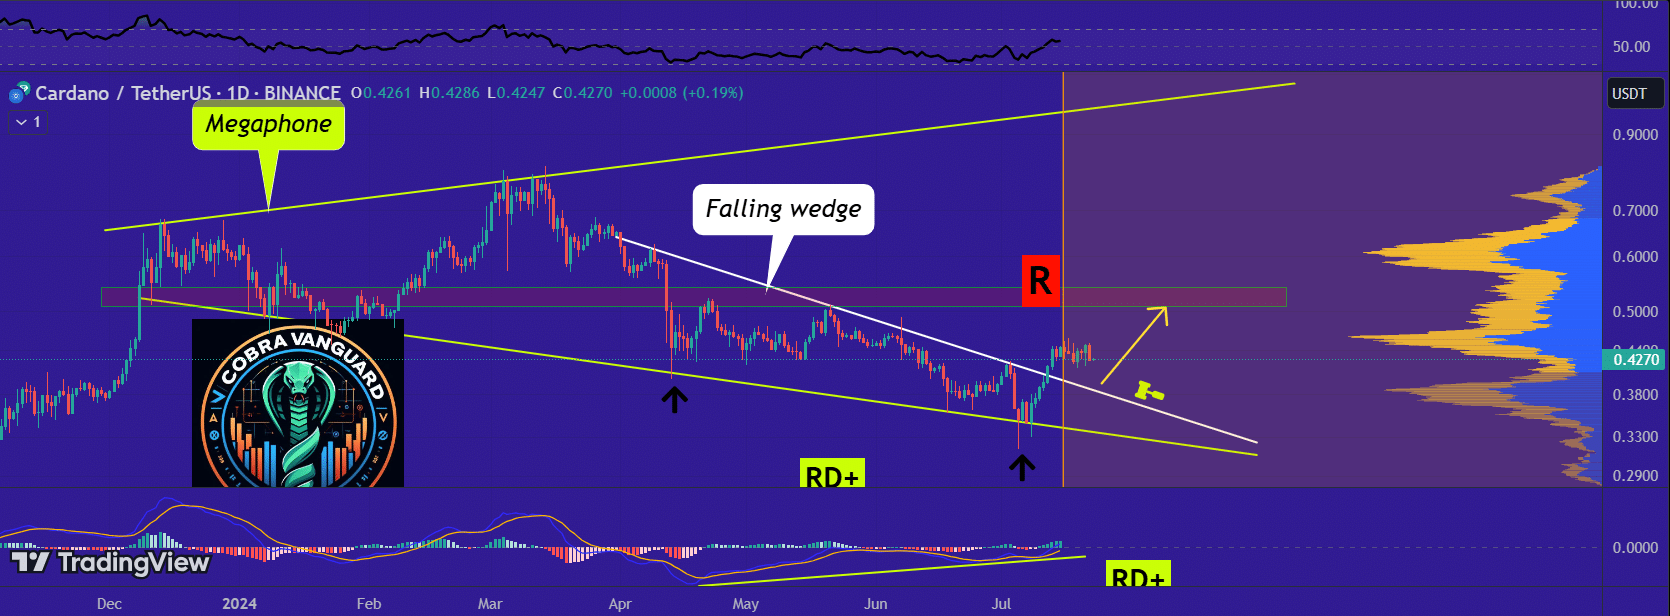
The daily chart shows immediate resistance at $0.5, a crucial level for Cardano to surpass to confirm a sustained upward movement. Support levels are around $0.38 and $0.29. These levels provide a safety net for any short-term price corrections.
Bullish divergence is evident in both the MACD and RSI indicators on the daily chart. These indicators confirm the positive outlook by showing that the recent price movements align with a bullish trend. CobraVanguard concluded that Cardano’s breakout from the falling wedge pattern is a strong indicator of potential price appreciation.


