
Ethereum Continues Its Soaring Run
 coinidol.com 23 July 2024 14:12, UTC
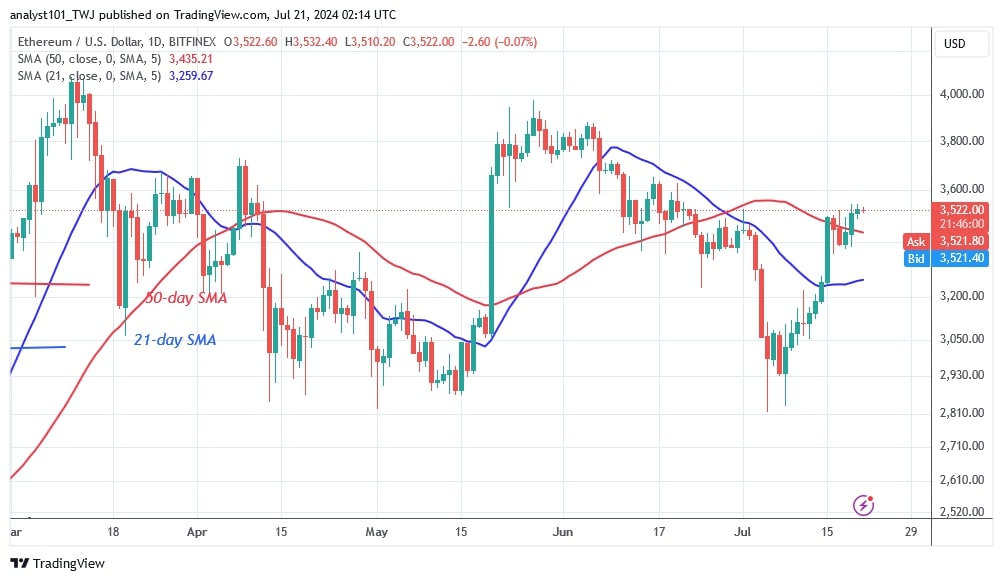
 The price of Ethereum (ETH) has entered an uptrend after breaking above the 50-day SMA on July 19.
Long-term analysis of the Ethereum price: bullish
On July 15, the bulls failed to sustain the price above the 50-day SMA and it remained between the moving average lines for the next five days.
If the 50-day SMA support holds, the largest altcoin will try to rally. Ether will rise to the next resistance level at $3,730. Beyond that, the uptrend will continue to the high of $4,000. However, if the 50-day SMA support fails, the bears will push Ether back to the region between the moving average lines. The selling pressure will extend to the low above the 21-day SMA at $3,200.
Analysis of the Ethereum indicators
The value of the cryptocurrency rebounded above the 50-day SMA support after two tests of the barrier. The price bars are above the moving average lines but encounter resistance at the high of $3,500. Ether price is stabilizing as doji candlesticks reappear.
What is the next direction for Ethereum?
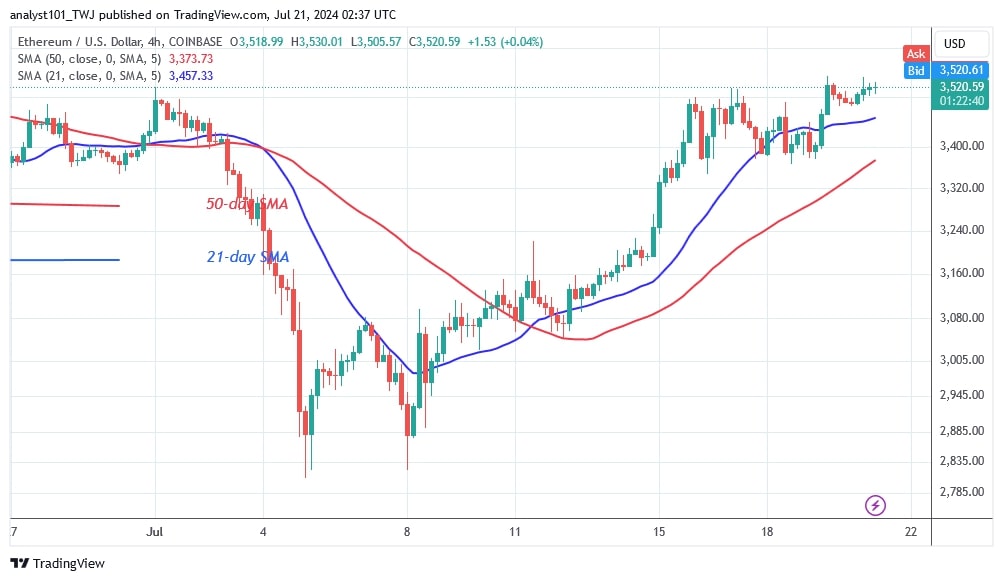
The price of Ether has been moving horizontally since July 15, when the rise stalled below the $3,500 resistance level, as Coinidol.com wrote. The 4-hour chart shows that Ethereum is trading in a narrow range above the $3,400 support but below the $3,500 barrier. Ether will rise if it breaks above the $3,500 high. The presence of the doji candlestick will slow down the price movement.
Disclaimer. This analysis and forecast are the personal opinions of the author. They are not a recommendation to buy or sell cryptocurrency and should not be viewed as an endorsement by CoinIdol.com. Readers should do their research before investing in funds.


