XRP Targets 2105% Upsurge as Monthly Chart Reveals Cup and Handle Pattern Indicating Massive Rally Potential
 thecryptobasic.com 31 July 2024 08:14, UTC
 XRP may be on the verge of a significant 2,105% upsurge to greater heights following the formation of a multi-year cup and handle pattern.
Market analyst Bobby A disclosed this in a recent analysis, choosing to let XRP’s monthly chart speak for itself. The cup and handle pattern is largely visible on the monthly timeframe, suggesting a potential breakout, with Bobby A’s ultimate price target requiring a massive 2,105% increase from current levels.
XRP Forms Multi-Year Cup and Handle Pattern
Notably, XRP formed the cup after it collapsed from the $3.31 all-time high in January 2018. Amid the correction, XRP dropped to a low of $0.1140, marking the rounded bottom of the cup. XRP then recovered from this low, spiking to a high of $1.96 in April 2021. This formed the second high of the cup.
However, data from Bobby A’s chart shows that the handle formed following the retracement from the $1.96 high. XRP has largely been consolidating since then, leading to the handle formation and setting the stage for a significant breakout.
The chart indicates significant horizontal support around $0.19. Bobby A showed that the 50, 100, and 200-month moving averages are converging, which often precedes major price actions.
In addition, the monthly XRP RSI is around 50, indicating a neutral zone. The MACD shows a bullish crossover, where the MACD line crosses above the signal line. This suggests increasing bullish momentum. Meanwhile, the Stochastic Oscillator also indicates a bullish crossover in the oversold region, bolstering the positive outlook.
The chart further reveals descending trendlines from XRP’s all-time high that the asset has tested multiple times. A break above these trendlines often signals a shift from a downtrend to an uptrend. This is crucial for XRP, as breaking these lines can lead to substantial price movements.
An Ultimate $13.7 Target
When such movements occur, Bobby A sets several Fibonacci targets. These levels mark potential resistance and target zones. Key levels include the 1.618 extension at $3.13 and the 2.618 extension near $6.32. The analyst presents an ultimate target of $13.7, which represents a 2,105% increase from the current level.
Meanwhile, XRP currently changes hands at $0.6212, having increased 3.21% over the last 24 hours. XRP trades near the upper band of the envelope indicator. This indicares a strong upward trend. The middle line of the envelope ($0.5749) acts as a dynamic support. This level supports the price during pullbacks.
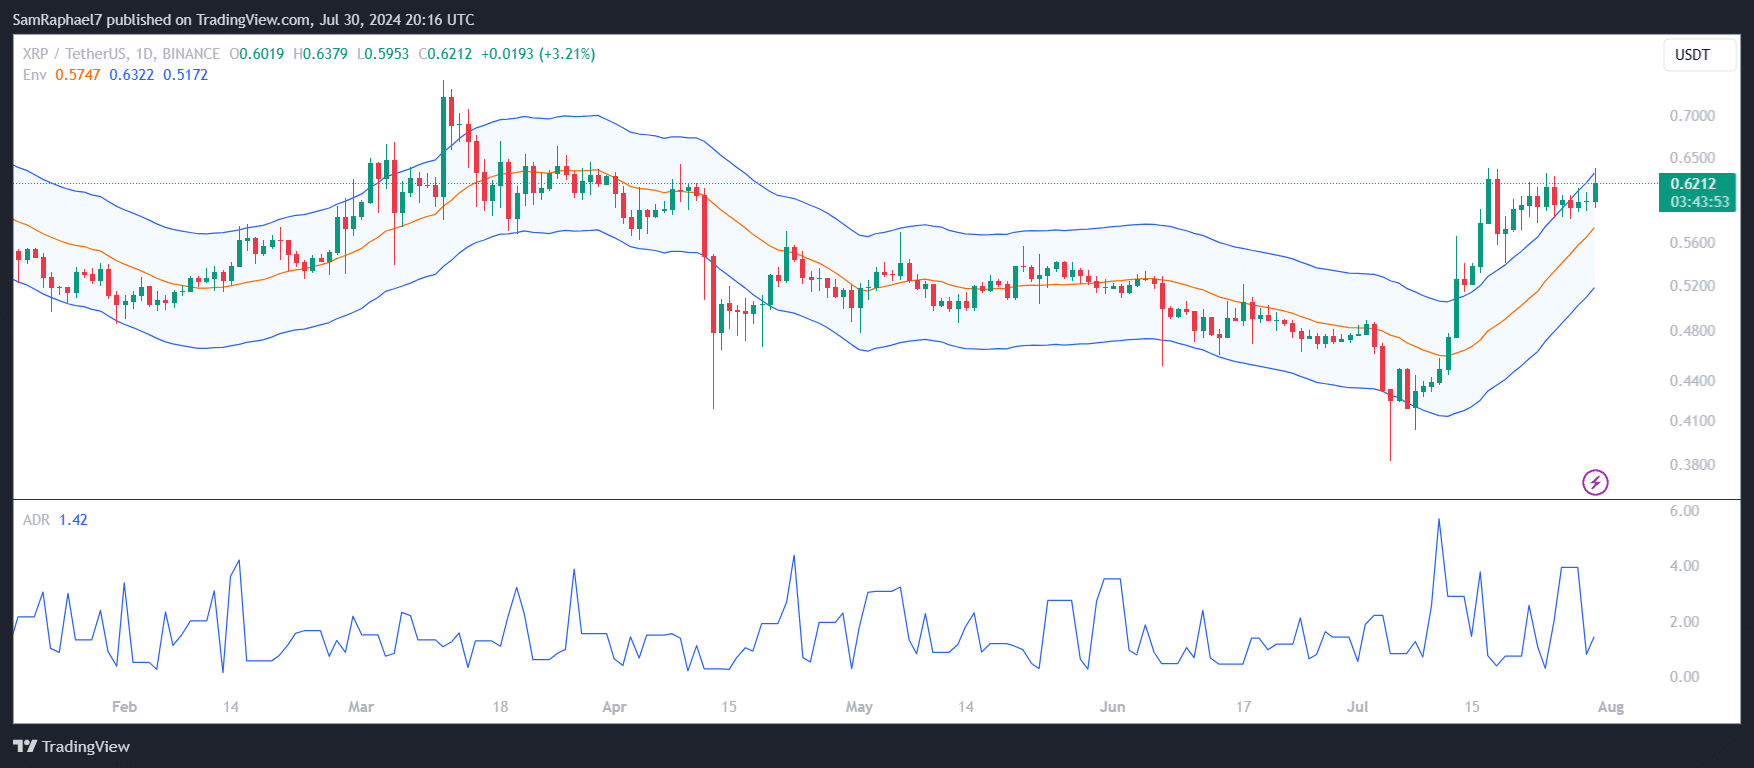
Further, the Advance Decline Ratio (ADR) at 1.42 indicates a healthy buying pressure. This ratio assesses the number of advancing prices against declining ones. A value above 1 signifies more prices are rising than falling, indicating bullish sentiment.


