
Stellar’s Breakout Sparks: XLM Price Ready For 50% Surge?
 thecoinrepublic.com 01 August 2024 04:38, UTC
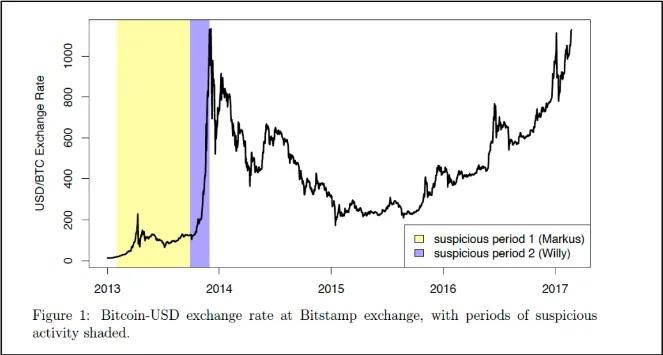
 The XLM price surged 5% in intraday, as Bitcoin took support from an upward trendline and showcased the bulls’ presence. The Stellar (XLM) price has received support from the 50-day EMA and has reached a $0.0990 level after the pullback from a brief surge to $0.1140.
XLM will likely complete the pullback soon with one more bullish push above $0.1140. It would ease a bullish revival amid a broader market pullback.
XLM coin’s market cap has surged nearly 5% to $3.082 Billion. The coin ranked 28th globally on CoinMarketCap. This large market capitalization showed a price trend of recovery. It put a full stop after one extensive lower lows spree over the past few months.
Meanwhile, the 24-hour spot volume has recorded a massive 116% growth overall in tradeable platforms, totaling $116.318 Million.
Accumulation Could Be Over Soon
The bullish consciousness seemed to be improving since the breach of the upper border of the falling wedge. It injected optimism as bulls seemed to have returned for an anticipated spectacular surge in the next half of 2024.
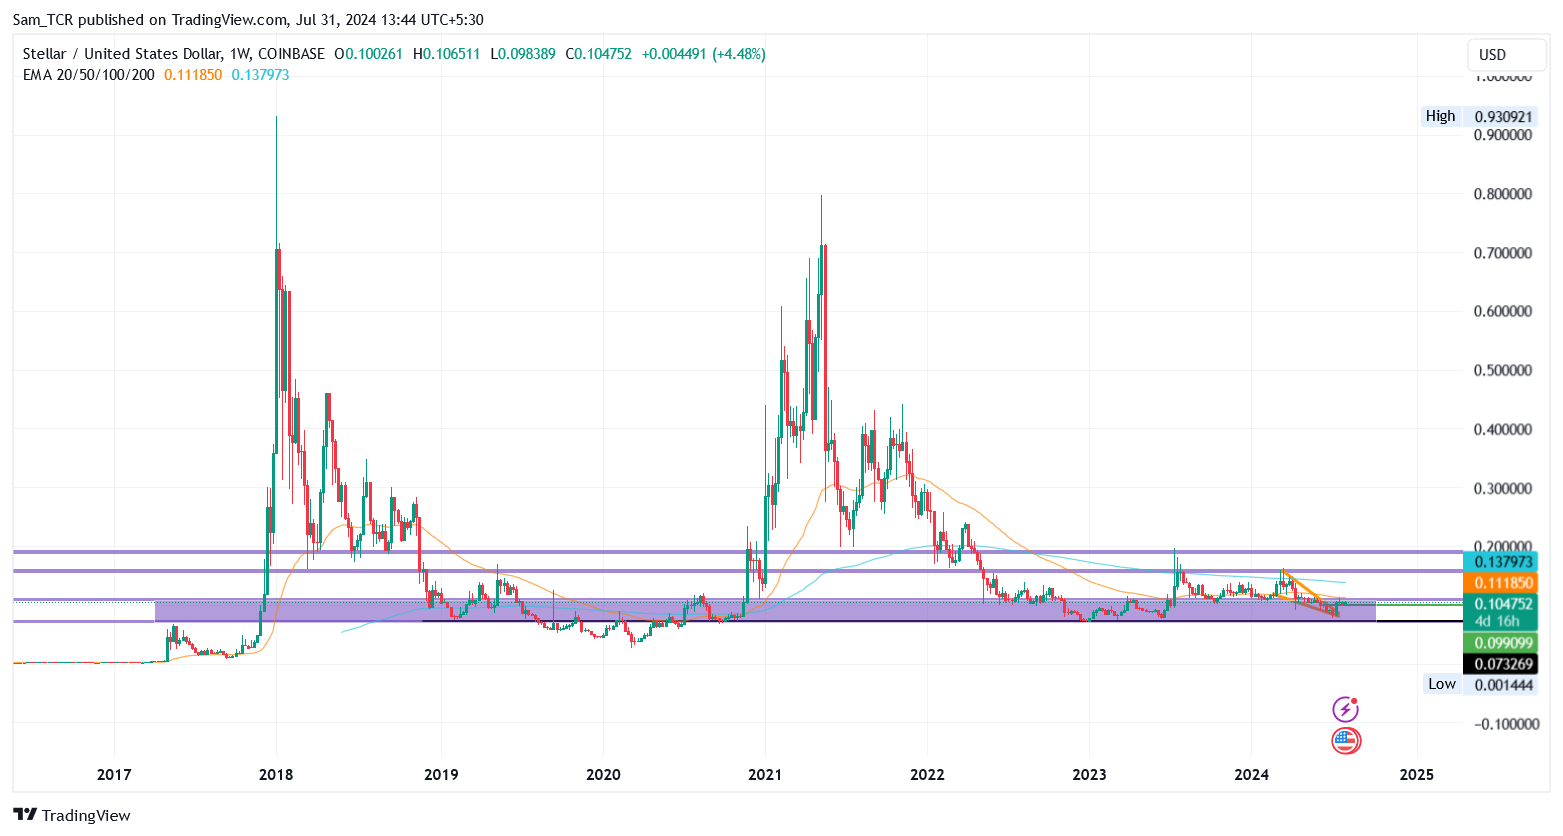
Over pinching out the entire chart of XLM, it seemed prepared to leave the accumulation zone soon. Despite the current position of XLM, it was at significantly discounted levels compared to its ATH of $0.7978.
Likewise, the higher possibility side of its trend reversal has attracted the interest of many institutions and smart investors in the market.
Stellar (XLM) Derivatives Data Analysis
The derivatives data highlighted a massive surge in their metrics for the recent trend. That’s due to more contracts having been added to the market. The open contracts surged more than 25%, and the total OI value was $39.55 Million.
The derivatives highlighted an enormous surge in the volume inflow in the derivatives market, with a more than 220% rise. The derivatives volume amounted to $163.18 Million.
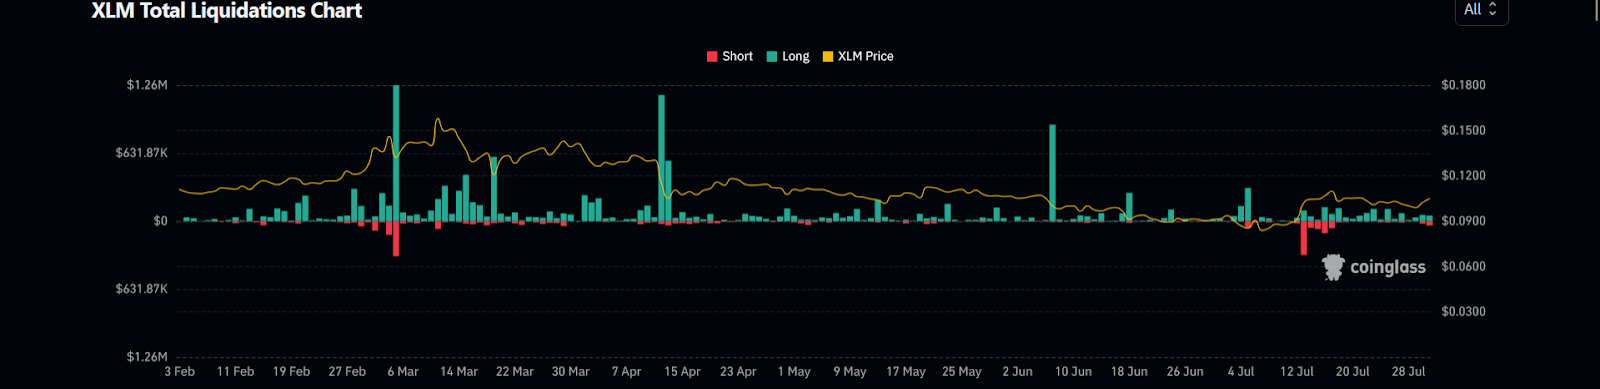
Despite this, the liquidation data showed more longs in the market than shorts, which could concern the current optimism (DYOR).
What Has the XLM Price Signified Over the Daily Chart?
The daily chart has displayed a surge of 45% from July 5th to July 17th, where the price breached the channel’s upper border.
However, the rally was brief, and the XLM coin price took a pullback up to the 50-day EMA. That depicted Stellar’s channel breakout forming another bullish pattern, precisely a bullish flag pattern.
Starting with the indicators, the RSI jumped above 14-SMA, which, as of writing, flashed at 58.64. The MACD has anticipated a bullish cross to form with further bullish candles on the daily chart.
Once past the 200-day EMA, turning the dynamic hurdle as support could give bulls an extra upper hand with targets higher.
Therefore, based on current sentiment, the hurdles in Stellar (XLM) would be at $0.1140 and $0.1200, respectively. However, the supports bears could eye on the contrary would be presented as $0.0990 and $0.0920, respectively.


