Skale Price Soars 8% as Optimism Builds: Can SKL Rise To $1
 thecoinrepublic.com 01 August 2024 09:11, UTC
 Being a blockchain network with zero gas fees to end users, Skale (SKL) has stayed green this week with an 8.11% surge and 3% on intraday. The optimism seems higher in Skale (SKL).
This optimism could result from collaborations and development updates from the Skale ecosystem.
gm gamooors ☕
Last week was a big one for blockchain gaming:
@metaversergame is bringing their metaverse game to SKALE
@SuperVet_io is partnering with SKALE to rescue animals via gaming
@cthulhu_awakens is using SKALE to bring horror games on-chainGet the details pic.twitter.com/TiZiN3NIs0
— SKALE (@SkaleNetwork) July 29, 2024
Many are optimistic over social platforms, like X, for its price to rocket ahead. One of those, a trader with many followers @CryptoBullet, has stated that this altcoin cycle is about to get an upside push. He further thinks the market’s current position seems similar to September 2020, a kind of silence before the storm.
To give you an idea of where we are in the #Altcoin cycle, let me show you my $ADA vs $SKL comparison
(just as an example, many coins look like #SKL right)Right now we are in September 2020
IMO we’re gonna go Up Only from here. Buckle up! pic.twitter.com/j21QthG4jN
— CryptoBullet (@CryptoBullet1) July 27, 2024
The analyst further shared an illustration of SKL’s drawing, which he crafted, where the current price displayed potential for $1 ahead.
What Does SKL’s Off-Chain Data Stats Highlight?
As per the stats from the CoinMarketCap website, the seat acquired by the Skale network (SKL) among the top crypto assets was 177th. Thus, it became one of the top 200 cryptos in terms of market cap.
When writing, its market cap grew by 3% to $282.80 Million, and the spot volume inflow surged by 59.10%. The total spot volume inflow was $41.03 Million. The liquidity seems good based on both volume and market cap of 24 hours, as the ratio was at 13.94%. The higher the ratio, the better liquid is present in the SKL. That makes trading easier, allowing users to buy and sell at the closest exchange price without much delay.
The tokenomics data showed 78.49% of the max supply was floating, precisely 5.493 Billion SKL out of 7 Billion SKL. The current price made its Fully Diluted Valuation (FDV) at $360.09 Million.
The yearly high in 2024 was at $0.1357. The current crypto market price (CMP) traded over 60% below the yearly high at the time of writing. Meanwhile, the annual low 2024 was at $0.0360, making the CMP nearly 35% higher.
SKL Onchain Metrics
Based on the rich list from the CoinCarp website, its top 100 held 76.15% of the floating supply. The ace in the list was Binance, which held nearly 7.5% of the supply alone, with 400 Million SKL’s in possession.
The holder’s chart of the SKALE coin has shown an undeniably strong adoption by the users. Its users have grown from 23K on August 2023 to the peak at 27K, precisely 27219 holder addresses.
Further on-chain data signified that transactions have increased. In the past 7 days, transactions over $100K have increased, totaling $8.58 million.
The concentration of large holders exceeded 87%, where investors’ concentration was 43.12%, whales’ concentration was 43.70%, and the Retail crowd held 13.18%.
The asset transactions have increased in the past two days, signifying large transfers, as a spike was witnessed, where the tax volume surged from 14.14 Million SKLs to 70.19 Million SKLs.
Moreover, compared to the buying price of addresses, the tokens’ current price showed that the bullish presence had slightly improved the positions of some holders.
Despite that, the bullish presence is not enough to turn the majority positions in green, as 28.35% are in green, which makes 7.44K addresses. The major holders are sitting in losses, which are 17.67K addresses. Those are approximately 67.33%, and holders at the money are 1.13K addresses with 4.32%.
Decoding Possible Outcomes in SKL Price Chart
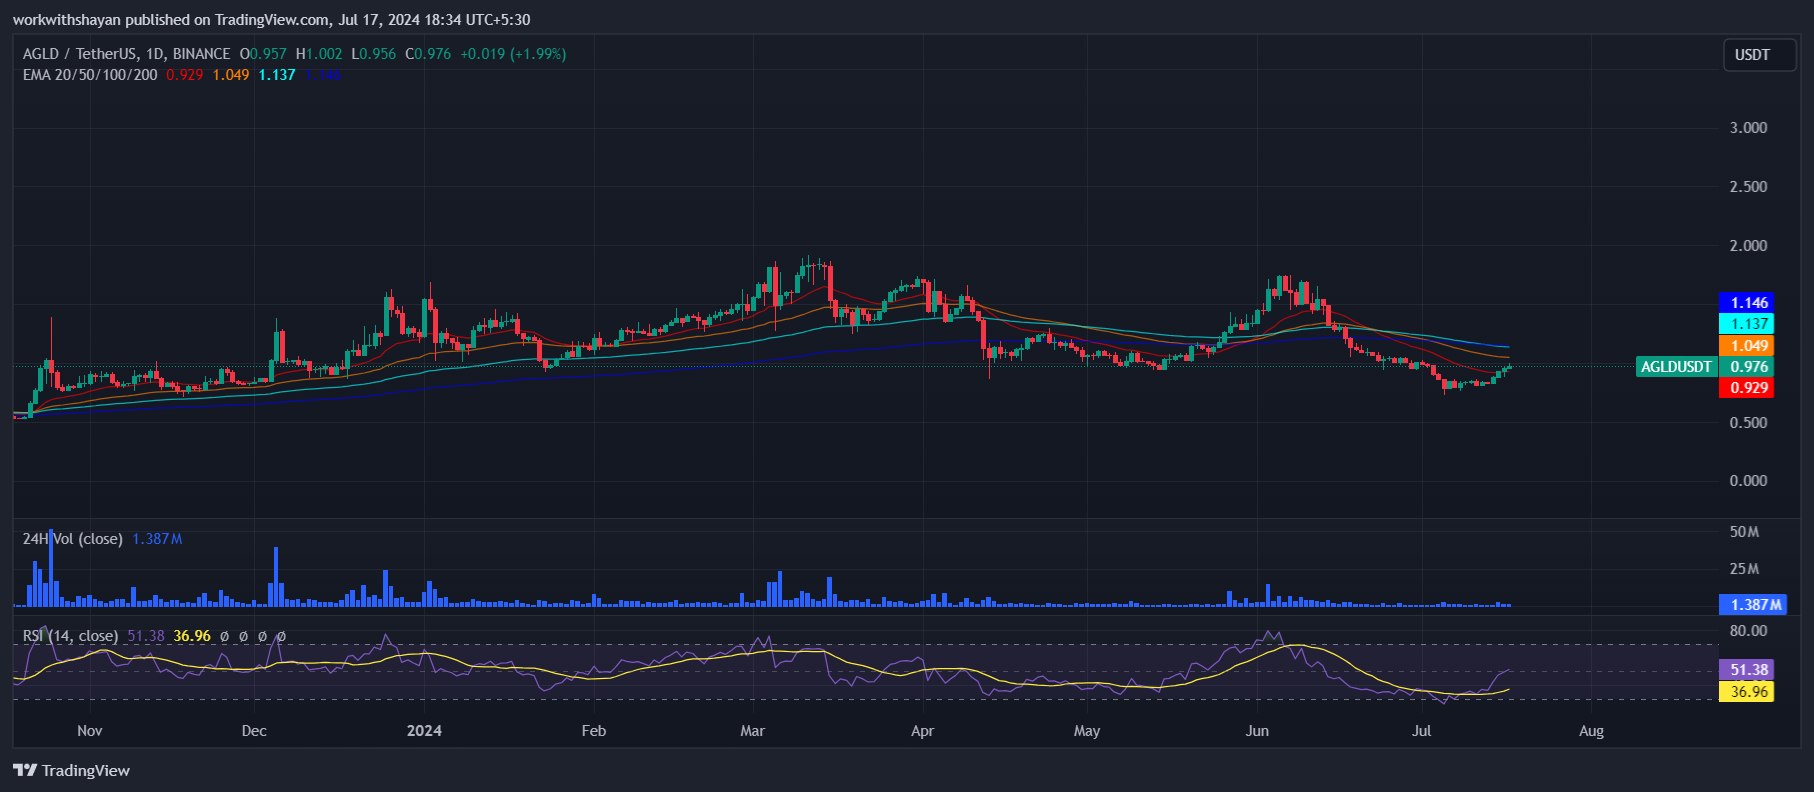
The SKL price started 2024 with a nearly 250% surge by March end of 2024, where the instability led to profit booking. The bears took advantage and consumed all its gains of the first quarter by the second quarter of 2024.
The third quarter showed a bullish presence from the same critical support zone that earlier displayed unprecedented advancement in price.
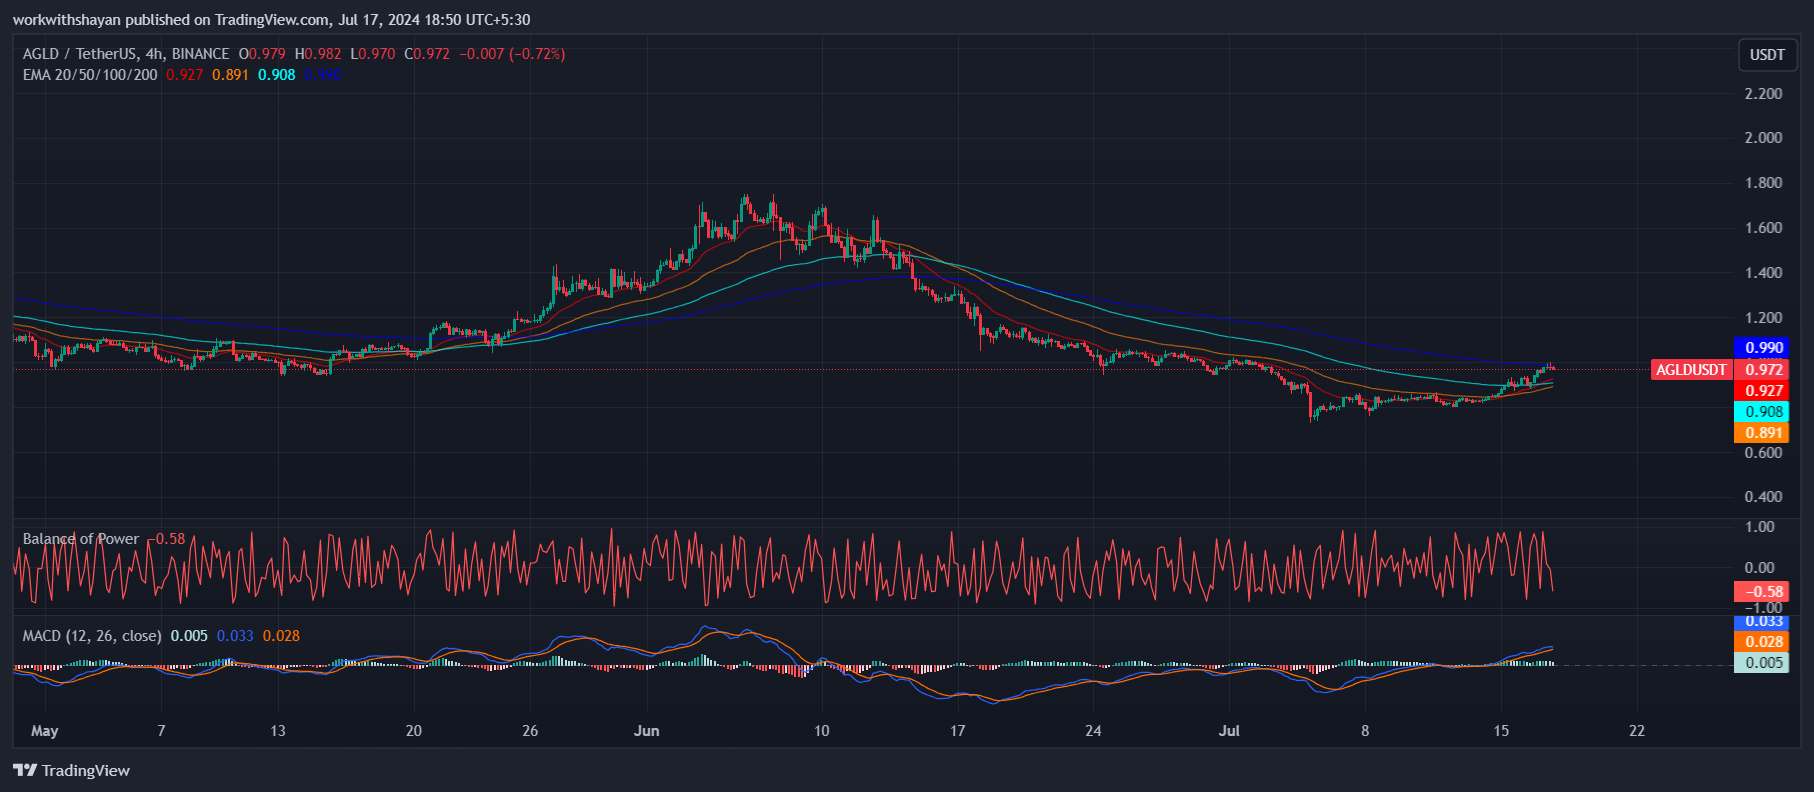
At press time, the price traded near the 50-day EMA band, where it got the opportunity to surge from an upward trendline.
In the past, the 50-day EMA led towards the 200-day EMA. On the better side, if the price manages to pierce the 200-day EMA, the dynamic hurdle would turn into dynamic support, and optimism would increase.
When writing, the price depicted a bullish crossover in the MACD vicinity, and the RSI has been near the median line at 52.81.
Therefore, the resistance lies around $0.0675 and $0.0850, respectively. On the contrary, the support could be present at $0.0450 and $0.0390, respectively.


