
JasmyCoin (JASMY) Recovers 55%, Are Bulls Aimed At $0.044?
 thecoinrepublic.com 01 August 2024 08:57, UTC
 The JasmyCoin (JASMY) has displayed a comeback this month after a lower low spree from the recorded peak of $0.04413. The JASMY had shown nearly 55% growth this month and 11% this week at press time.
Based on the chart, many anticipate its return to the previous month’s recorded peak, contingent on buyers. Let’s find the possibilities in this article in depth.
On Chain Data Insights In detail
JASMY was trading at $0.03009 at press time, losing 4.88% in 24 hours. Crypto market intelligence platform intotheblock exhibited that the concentration by large holders is good.
The retail holdings were 22.19%, investors’ holdings were 23.52%, and whales holdings concentration was 54.30%. The 30-day price correlation of JASMY with Bitcoin stands at 0.89.
The liquidity of the crypto was moderate at 8.26%, while the market cap value of the crypto stood at $1.487 Billion. The crypto’s circulating supply was 49.2 Billion JASMY, and the maximum supply of the crypto was 50 Billion JASMY. This displayed 98.60% of the crypto circulating in the market.
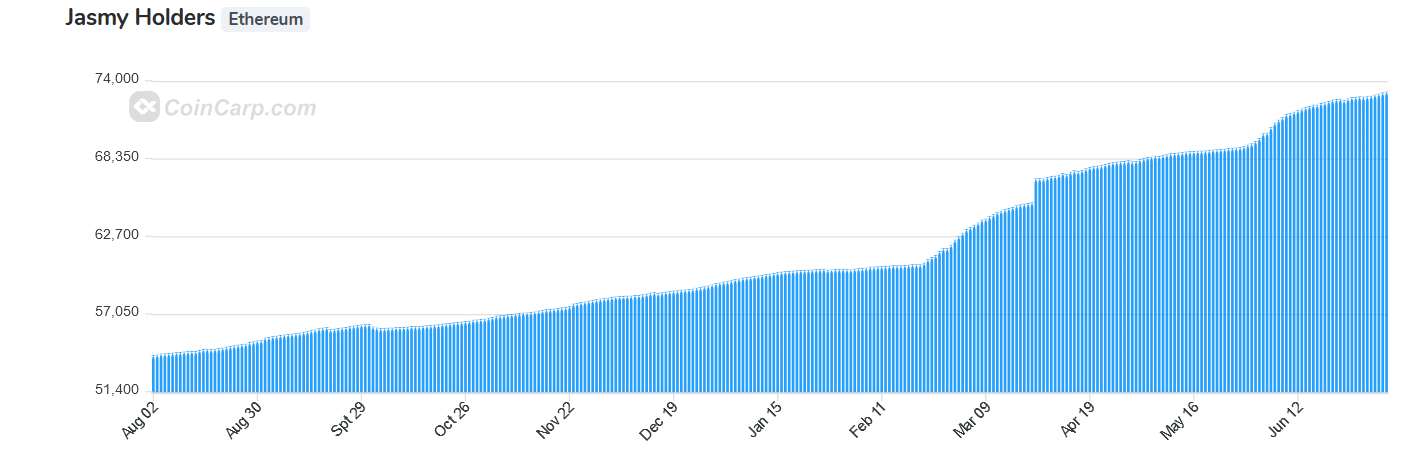
The holder’s chart showed growth from 54K on August 2023 to the peak at 73K, which is precisely 73311 holder addresses.
JasmyCoin’s holders’ composition by time illustrated that 7% are traders who transfer within 1 month or less. In contrast, 40% of the cruisers hold the asset for nearly 1 to 12 months. Meanwhile, 53% of holders have been holding the crypto for 1 year.
Meanwhile, 55% of the transactions made in the crypto asset are from the West, while the East does the remaining 45%. Also, the average time for JASMY crypto was held was 12 months. The transactions over $100K were on the rise, where the past 7 days amounted to $45.03 Million.
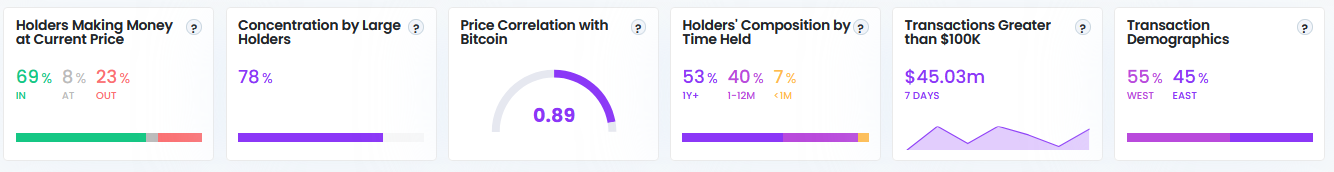
Onchain data shows that 69.90% of the crypto holders are in profit, which is 50.7K addresses. Additionally, 23.68% of the crypto traders are at a loss (17.17K addresses), while 4.65K addresses are at break even.
Decoding The JASMY Price Structure
The JASMY had a breakout at the end of May 2024 out of a symmetrical triangle pattern. This signified a more than 165% increase on the daily chart. However, the instability led the price to deteriorate to $0.02.
After the sustenance with a larger market, from July 5th onwards, JASMY’s bullish structure commenced once again after the June sell-off. It ended with the coinciding support at the 200-day EMA.
The traders spotted opportunities to buy the dip amid the previous oversold conditions. This increased liquidity enabled it to build momentum for a significant trend reversal.
Several indicators point towards further acceleration in gains and that JASMY is still in the buy zone. Moreover, the technical price action hinted at a breakout continuation to June’s peak of $0.04470.
Indicators like 50-day and 200-day EMA have supported the momentum for upside. The MACD indicator showed a bullish cross with a histogram at 0.00034. The RSI in JASMY flashed at 56.00, above 14-SMA.
Therefore, the resistance is at $0.03535 and $0.04413, respectively. On the contrary, the support lies at $0.02749 and $0.02248, respectively.


