
XRP Can Surge to $378 as It Repeats Three Bullish Crosses That Led to a 600x Spike
 thecryptobasic.com 01 August 2024 08:48, UTC
 XRP is on the brink of a potentially significant breakout, reminiscent of its 2017 historic surge amid a repeat of three bullish crosses in multiple indicators.
Market analyst JD disclosed this in a recent analysis, highlighting crucial formations and indicators that suggest an explosive XRP surge. The analysis comes amid XRP’s solo run, which has seen the crypto asset reclaim the $0.63 price.
XRP Symmetrical Triangles
An accompanying monthly chart from JD shows the formation of two symmetrical triangles. The first symmetrical triangle spanned from 2013 to early 2017 on the back of a four-year downtrend.
This trend ended dramatically when XRP broke above the upper trendline at approximately $0.005, leading to a meteoric rise that saw its price increase 600 times within a year. The upsurge allowed XRP to hit the current all-time high value of $3.31 in January 2018.
Currently, XRP is navigating a second symmetrical triangle that has been forming since it dropped from the $3.31 ATH. This triangle has persisted for seven years and is characterized by a series of lower highs and higher lows, indicating a consolidation phase.
Interestingly, amid the constant slope, the upper trendline of this triangle now hovers around the $0.75 mark. JD’s chart suggests that this is a crucial resistance level. A break above this line could signal the start of another significant bullish phase.
Three Bullish Oscillator Crossovers
Meanwhile, JD called attention to the importance of the three bullish crosses observed on key oscillators: the RSI (Relative Strength Index), Stochastic RSI, and MACD (Moving Average Convergence Divergence). In 2017, all three indicators showed bullish crossovers before XRP’s explosive rally.
Data shows that all these three indicators are now showing signs of similar bullish crossovers. Should these crossovers coincide with the symmetrical triangle breakout as observed in 2017, XRP could prepare the groundworks for the much-awaited upsurge.
Notably, the XRP weekly chart shows Fibonacci retracement levels that XRP needs to surpass to confirm the breakout. Immediate resistance levels are identified at $0.6839 (23.6% retracement) and $0.9308 (38.2% retracement).
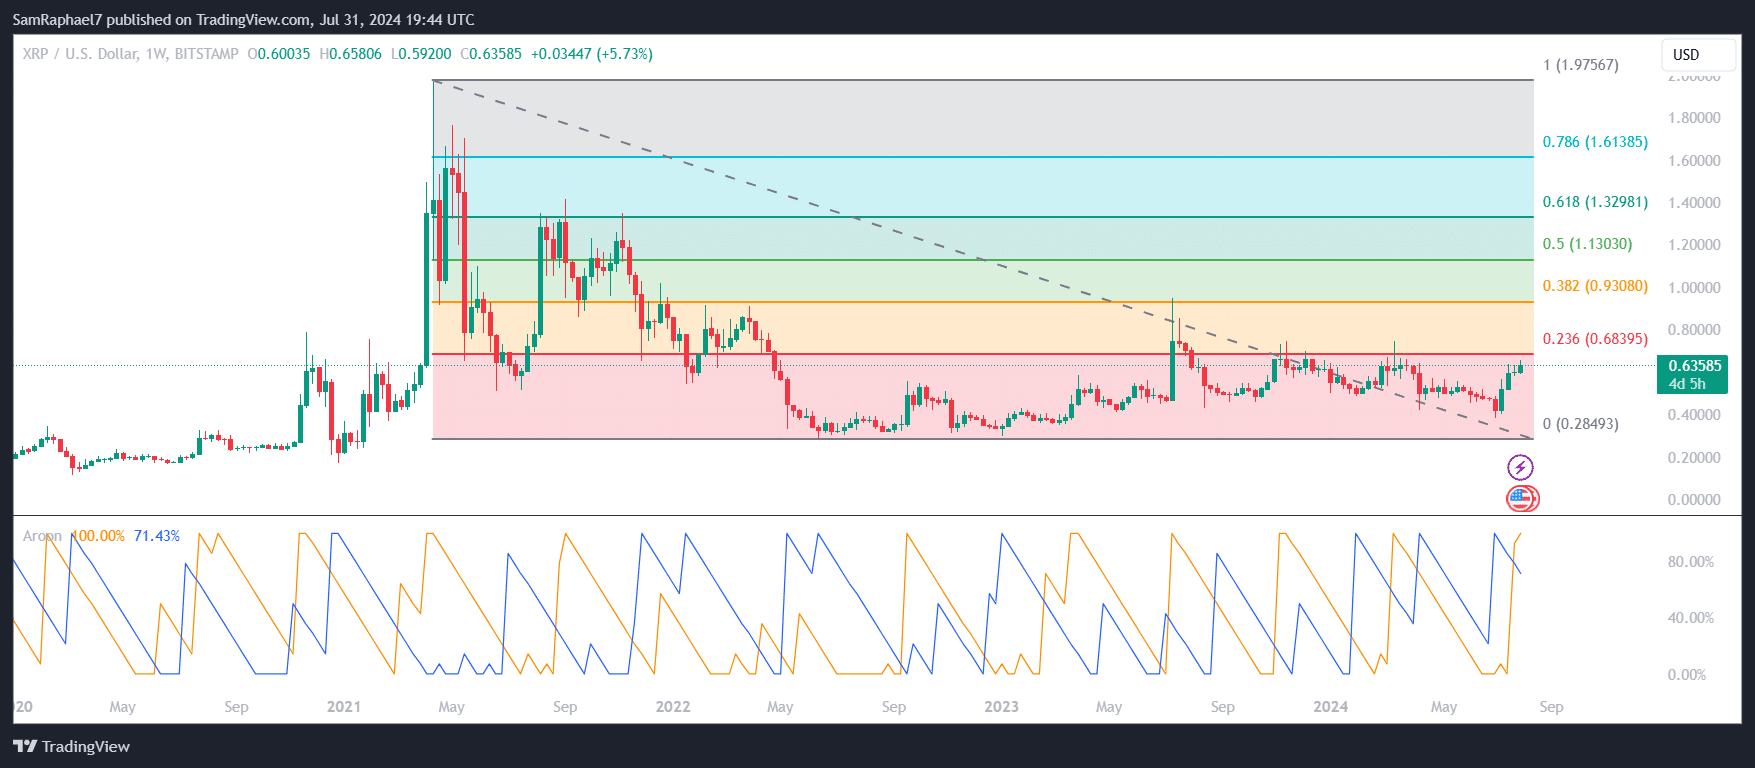
Overcoming these levels would bolster the case for XRP reaching higher targets, such as $1.1303 (50% retracement) and beyond. To break above the symmetrical triangle, XRP only needs to breach the Fibonacci 23.6% retracement.
Moreover, the Aroon indicator on the weekly chart provides additional bullish signals. The Aroon Up line is close to 100%, indicating strong upward momentum, while the Aroon Down line is declining, reflecting weakening bearish pressure. This setup further supports the bullish outlook for XRP.
If XRP surges 600 times its current price of $0.63, the new price would be $378.


