
50% Fibonacci Seems Final Support for Crashing Tron, Will TRX Reverse for a 27% Surge?
 thecryptobasic.com 01 August 2024 14:11, UTC
 As the bear pressure gains momentum, Tron faces an imminent threat of a bearish breakdown. Will the multiple support elements at $0.1261 hold the falling prices for a bounce-back rally?
Repeating the historic fall after facing massive supply above $0.14, Tron tanks almost 7% this week. The bullish failure with a double top formation prolongs the lower high formation, leading to a resistance trendline.
With the recent bull cycle facing a threat with the surge in supply inflow, will the bears overtake trend control? Let’s take a closer look at the Tron price analysis to find out the dip to buy.
Converging Trendlines Contracts Volatility
In the daily chart, the Tron price action reveals a triangle pattern starting from early 2024. With a double bottom reversal from the resistance trendline, $TRX undergoes intense correction.
The ongoing downfall reflects a negative cycle within the trend continuation pattern. Further, the negative cycle breaks under the 50D EMA and forms three consecutive bearish candles.
The daily RSI line dips below the halfway line, reflecting a mammoth supply inflow. However, the intraday gain of 0.44% retests the broken 50D EMA and rekindles hopes of a bullish revival.
Furthermore, the 100D and 200D EMAs are the next-in-line dynamic supports to prolong the bullish trend.
Network Growth For Tron Continues
Tron’s TVL has increased by 13.12% from the low of $7.195Bn to the current value of $8.139Bn. Ranking second only to Ethereum, Tron dominates 8.43% of the total value locked by all chains.
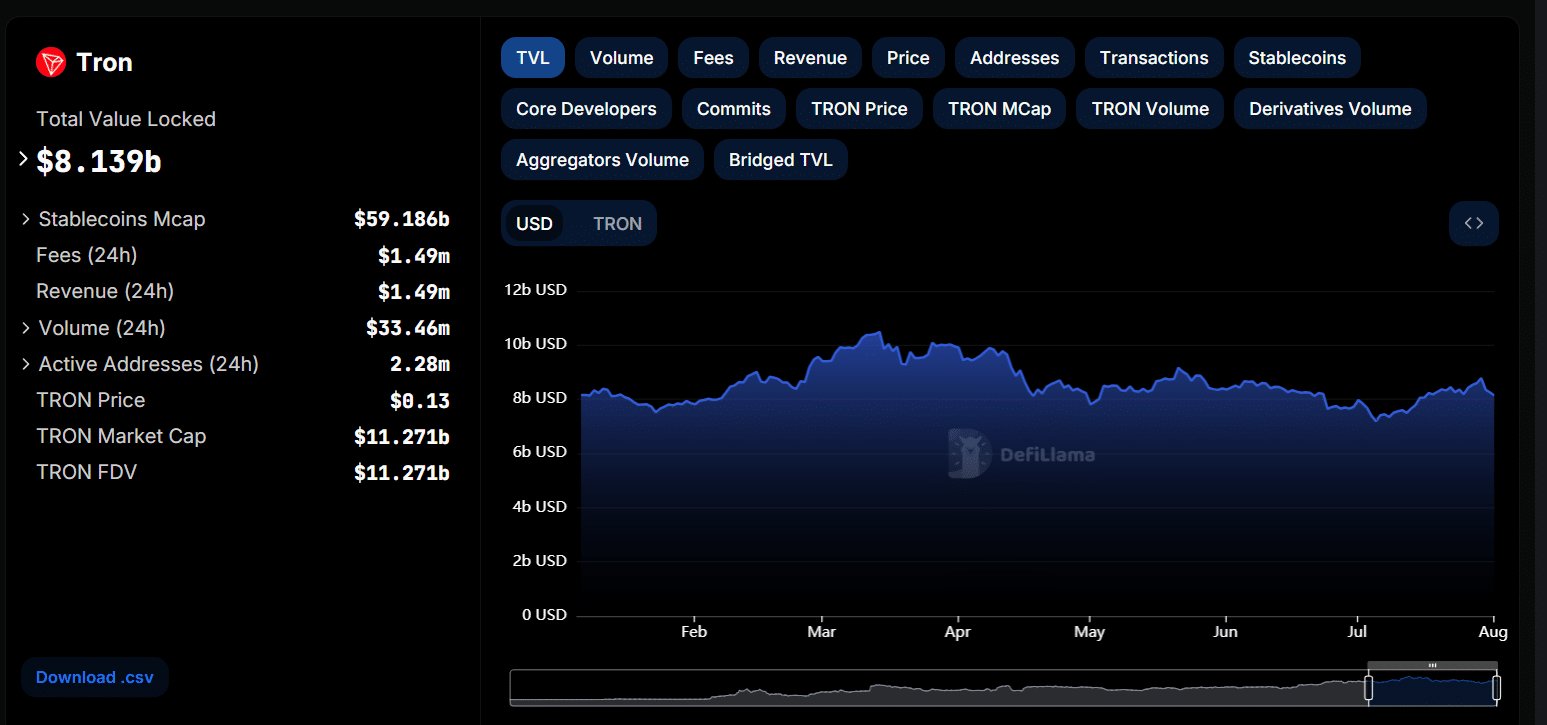
With 7.52Mn transactions over the Tron network, the 2.42Mn active addresses reveal the network growth.
Will Tron Fight Back for a Breakout Run?
As per the Fibonacci levels, the 50% Fib level at $0.12617, coinciding with the 100D EMA, is a crucial support area. Hence, the confluence of multiple support levels is a high potential area to buy.
A bullish reversal from the support trendline igniting a bull cycle will increase the breakout rally chances. In addition, the overhead trendline breakout could result in a price jump to the 1.618 Fibonacci level at $0.1641, a 27% growth.


