
BEAM Bulls Battle Bearish Channel: Will It Break Free For 2x Gains
 thecoinrepublic.com 02 August 2024 15:42, UTC
 In the year-to-date period, the BEAM token price has shown a bearish price structure on the daily chart. The bearish channel was formed as a result.
Inside that channel, the BEAM price advanced by over 40% from the lower border to the higher border in the past month. At the higher border, it faced dynamic resistance that coincided with the 50-day EMA band.
According to CoinMarketCap, the BEAM crypto plummeted by 5% in market value. It increased by 80% in trading volume spot inflows in the last 24 hours.
BEAM Market Cap and Open Interest
Its market value at press time was $895.3 Million, and its trading volume was $25.826 Million. That makes it the 73rd largest crypto in terms of market cap, but it has a concerning liquidity ratio of 3%.
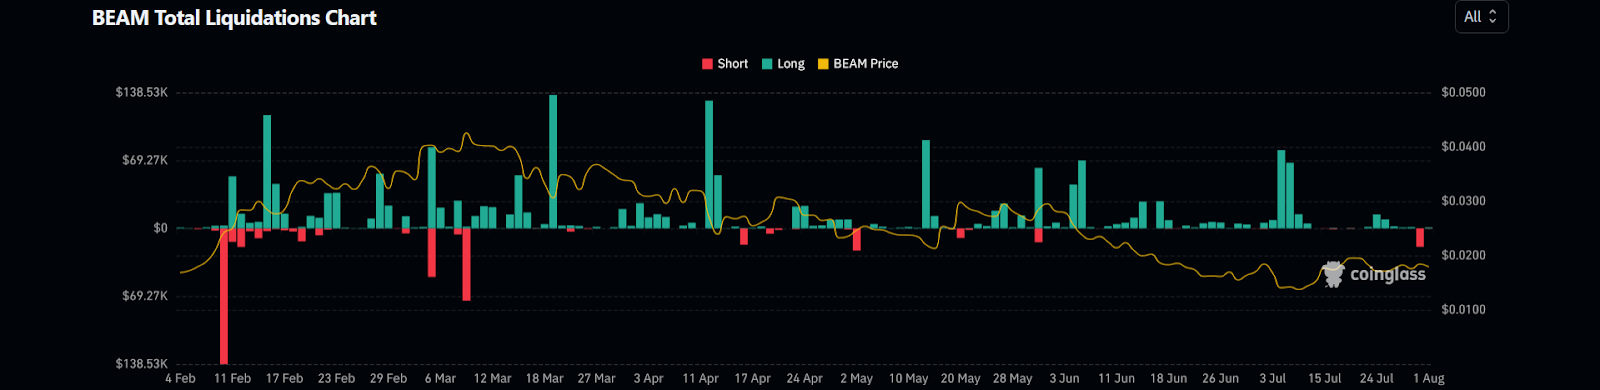
When writing, BEAM’s open interest was $7.48 Million. As per CoinGlass, it fell by 10.65% in the previous session. The long-versus-short ratio for 24 hours was 0.9384. The short liquidation was $19.14K, versus $917.91 for the long liquidation.
Despite bears ‘ dominance, this signified a bullish angle, which could create major volatility in BEAM. Investors and traders should be cautious and prepared (DYOR).
BEAM Price Structure Insights
The BEAM price traded at the $0.01798 level at press time. It revealed a pronounced downtrend, with a steady decline over the past few months.
This continuous decrease to lower levels was illustrated by the development of consistent lower lows on the daily chart. It showed a strong, bearish structure.
In the event of a price resurgence, BEAM might encounter interruptions at higher levels. This hypothesized resistance could prompt a liquidity grab, pushing the price backward toward its previous swing lows.
Recent price actions reinforced the bearish outlook as the BEAM price deflected from the upper border. It happened with an increased struggle near the 50-day EMA.
Yet again, the asset breakdown suggested a surged likelihood of continued southward momentum.
Indicators Perspective in BEAM
The prevailing technical indicators and sentiment needled towards continuing the bearish trend in the near term.
Technical indicators for BEAM displayed bearishness due to uncertainty in its price trend. The 20-day and 50-day EMAs presented a death crossover, ongoing since June 2024, signaling potential bearish momentum as of writing.
MACD has overlapped with the signal line, depicting the current struggle in BEAM’s sideways price action.
Meanwhile, the RSI demonstrated a lack of movement, taking support at the median line. However, it already declined below the 14-day SMA, which could indicate a future fall towards oversold conditions.
Overall, it has been evident that technical indicators like EMAs and RSI depict bearish momentum despite some short-term gains. Moreover, an inclination was observed in perpetual trading volume inflows, which hints at potential volatility.
Therefore, the Beam price might take support at the $0.1251 and 0.1501 levels. It might face resistance at the $0.0331 and $0.0401 levels.


