Arweave Plummets 30% Amid Market Downturn; Can It Find Support
 thecoinrepublic.com 05 August 2024 07:58, UTC
 In Arweave, from July 5th onwards, a bullish spell was induced in correlation with the larger market but was brief, lasting until July 21st, 2024, up to the $34.5 mark.
The significant interruption level at $34.5 stopped bullish acceleration by limiting the gains up to 70% only. Thereon, the encountered hurdle has pushed the price downwards in the past two weeks by nearly 30%. The market leader Bitcoin’s decline most likely influences it.
With BTC declining to $61500, the entire crypto market had a red blanket. That has led its global market cap to decline, reaching $2.2 Trillion, with a 4.5% intraday fall. Among others, the AR token’s market cap dominance was 0.07%.
Arweave Off-Chain Data Statistics
According to CoinMarketCap, the Arweave (AR) spot volume inflow had decreased by 23.15%. It reached $66.354 Million, and the market cap has fallen 8% on intraday, valued at $1.590 Billion. It showed a decline in the demand for the token among the investors.
With more stats, the Arweave token has ranked 50th globally in terms of market Capitalization. Meanwhile, it had 99.47% circulation out of a max 66 Million AR supply, and precisely 65.62 Million ARs were flotation (at press time). From its present price, its FDV stood at $1.598 Billion.
The concerning point would be the liquidity ratio, which was at 4%, per the 24-hour volume-to-market cap ratio. So, investors and traders must be cautious (DYOR).
What Were the Lowest & the Highest Arweave (AR) Prices?
As per the TradingView platform, the Arweave (AR) formed an all-time low (ATL) price at the beginning of its chart journey of $0.4870 on May 1st, 2020. From this low, the current price has traded 4000% higher.
Likewise, on the daily chart, the all-time high (ATH) of $91.09 was registered on Nov 1st, 2021. Comparatively, the current market price (CMP) has traded nearly 70% down.
Arweave (AR) Derivatives Insights Illustrations
Arweave’s (AR) open interest fell by 7% in the previous session, which was at $58.17 Million. As per CoinGlass, there has been a significant decrease in the OI since the last day.
When writing, Arweave’s(AR) derivatives volume inflow decreased by 15.01% for the short-term downside trend, where the volume was $113.91 Million.
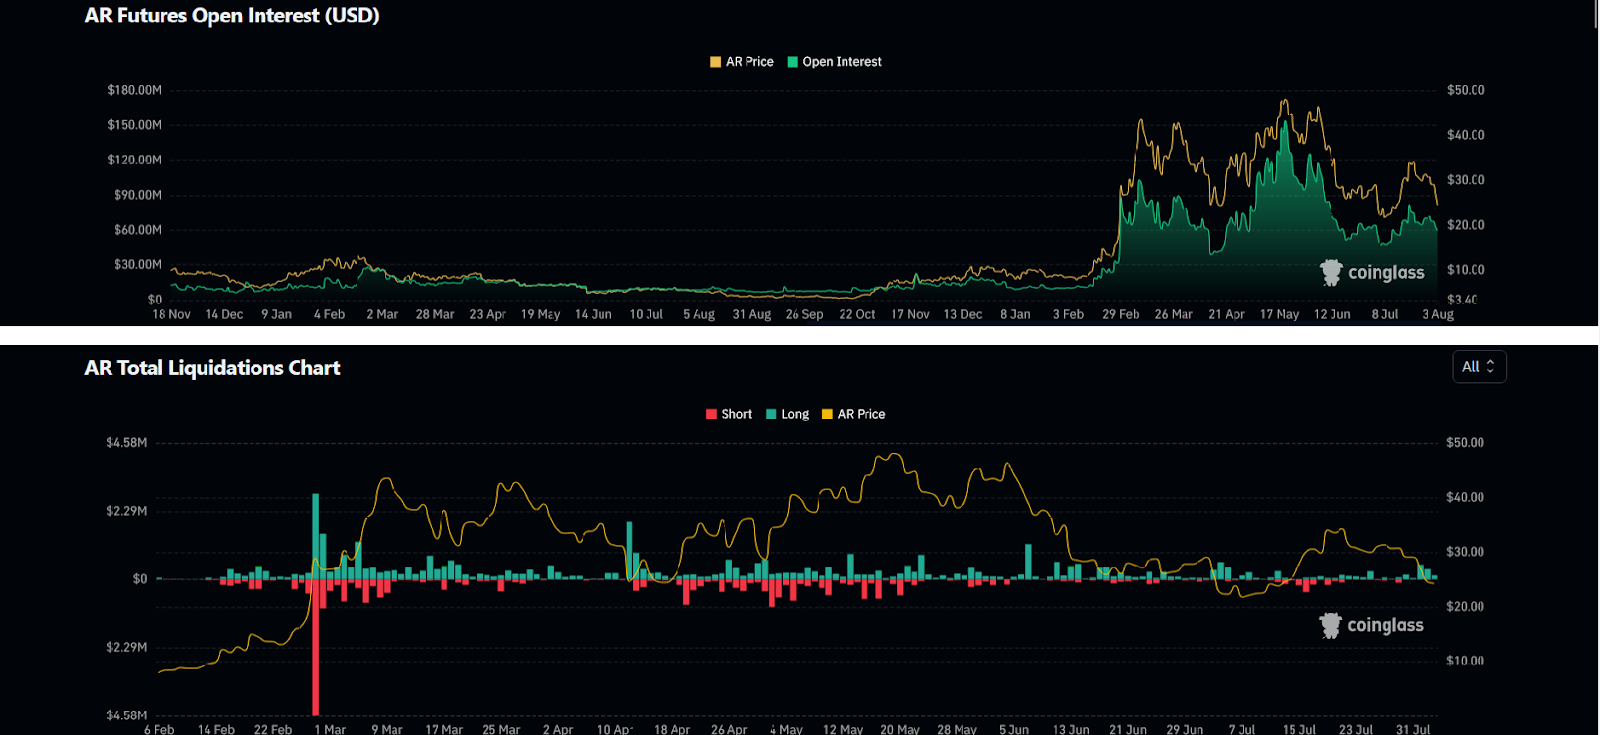
The long versus short ratio for 24 hours was 0.9106, which exhibited that longs were greater than shorts side liquidation. It signified the possibility of further downward acceleration in AR. The short liquidation amount was $23.10K versus $369.99K for the long liquidation.
Will the AR Price Plummit More?
AR token price has outperformed 86% of the top 100 crypto assets in the past 1 year. However, it consolidated in a dynamic range, followed by strong volatility.
In the last few days, It dropped from a swing high of $49.5 and lost gains. The witnessed decline raised some concerns among its investors.
It suggested that the AR market has undergone a period of correction and consolidation in its price.
The EMA bands of 50-day and 200-day EMA showcased a further push downwards. MACD formed a bearish cross, and RSI has reached 34.77.
Based on the current pessimistic situation, If the AR token price continues to decline, the bears might eye support levels of $12.51 and $19.81. This would be followed by the resistance of $35.01 and $50.01.


