XRP Bollinger Bands Support Breaks, What’s Next for Investors?
 thecryptobasic.com 05 August 2024 08:17, UTC
 XRP currently trades at a critical juncture amid a market crash that has pushed prices below the significant support provided by the Bollinger Bands.
The entire crypto market has suffered its biggest crash this year, resulting in most mainstream cryptocurrencies collapsing to lows last seen in February. XRP has not escaped this bloodbath, equally posting significant losses that have now placed it in a critical position.
Notably, for nearly a month, the lower Bollinger Band had served as a potent defense against steeper declines for XRP. For context, the Bollinger Bands help traders measure market volatility and also identify overbought or oversold conditions.
A drop below the lower band is a typically rare occurrence, which only occurs during times of intense selling pressure. While such a crash indicates a sharp increase in selloffs, it also suggests that the crypto asset in question may be oversold and could potentially rebound.
XRP Drops Below Lower Bollinger Band
XRP first retested the lower Bollinger Band yesterday when it dropped to $0.5137. However, it found robust support at this level, holding firm as it awaited strength to recover. Nonetheless, this never came, with the broader crypto market recording a sharp drop this morning. The drop is due to the crash in Japan’s equities and a decline in the U.S. stock market.
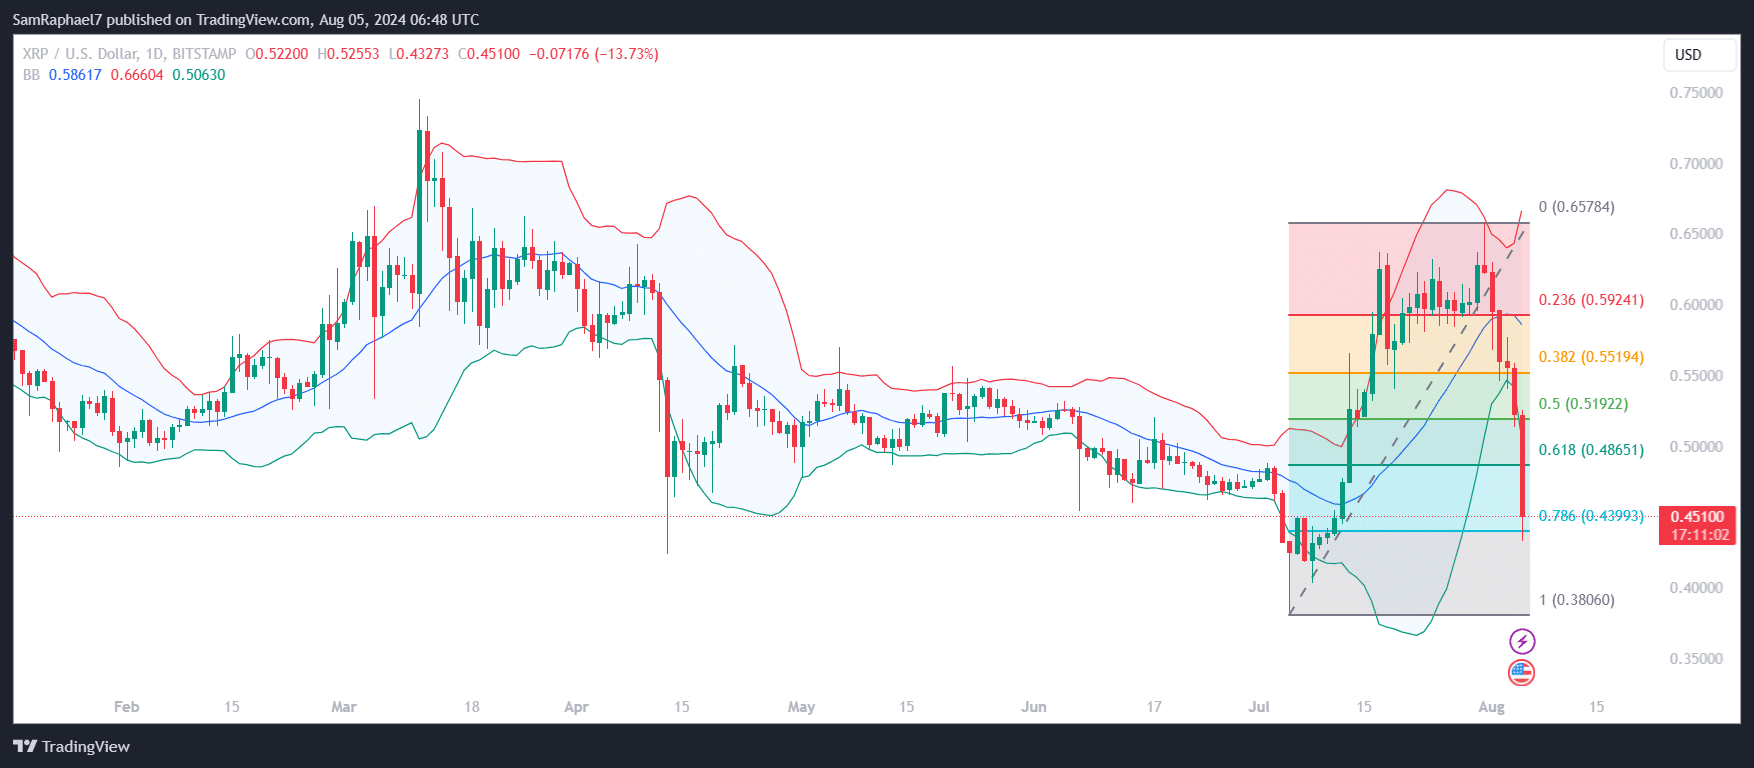
XRP is now down 11.98% today, having slipped below the Bollinger Band support. This level is especially critical, as XRP’s immediate defense sits at the $0.4399 level at the 78.6% Fibonacci retracement level. If this level gives way, XRP could collapse further to the $0.38 territory. However, this would set the stage for a possible double bottom formation.
A double bottom usually forms when an asset reaches a support, rebounds and then drops back to that support. In this case, the XRP support level rests at $0.3806, a level the asset hit amid the July 5 crash. If the ongoing bearish pressure pushes XRP back to this level, the double bottom formation could be on the horizon.
The formation would be confirmed when XRP rebounds from the $0.38 territory to break above the neckline at $0.60. At the current level, XRP is still far from recording this formation, but its price action in the next few days is extremely crucial.
XRP Monthly Bollinger Band Contraction
Interestingly, despite the 27.8% collapse in August, XRP has not broken below the lower Bollinger Band on the monthly chart. However, the monthly Bollinger Bands appear to be contracting, a trend which typically follows an explosive price surge.
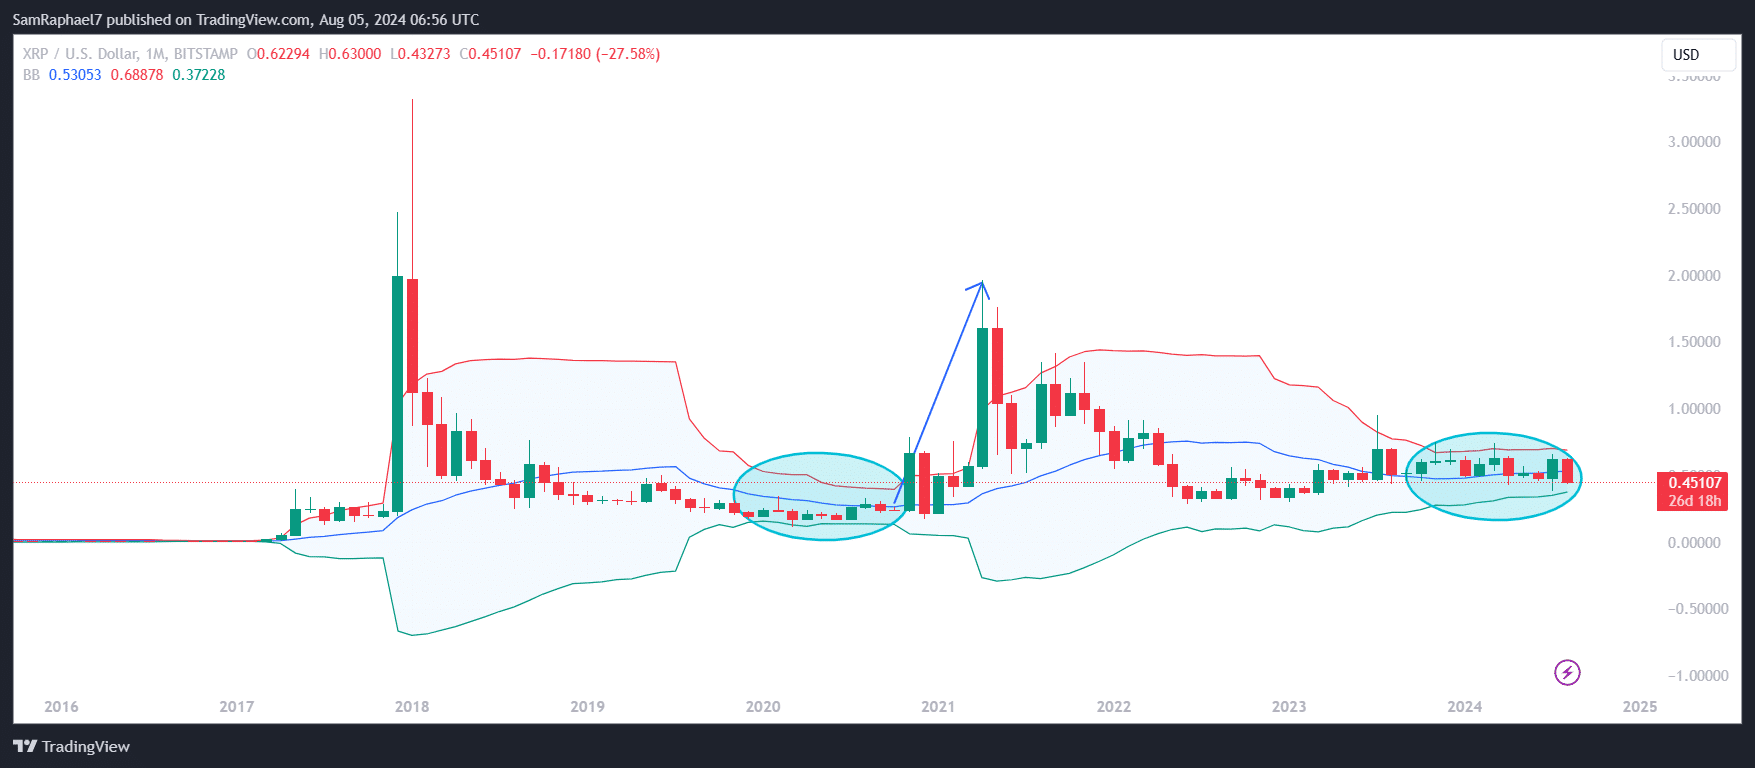
The last time this contraction occurred was from January to December 2020, with XRP equally recording a crash in December. This crash, which pushed XRP to an oversold position, was a result of the SEC’s lawsuit against Ripple. Despite this, the contraction eventually resulted in an XRP upsurge to $1.96 in April 2021.
The latest contraction took form in November 2023 and has persisted since then. With XRP now recording a similar collapse to the December 2020 drop, it is now oversold. A rebound could trigger a similar rally to what the market witnessed in early 2021. XRP currently trades for $0.4510.


