Ethereum Price Analysis: Is ETH on the Verge of Falling Below $2K?
 cryptopotato.com 05 August 2024 11:51, UTC
 The Ethereum market has seen a sharp 37% decline recently, driven by growing fears of an impending economic recession. This downturn has sparked widespread fear among investors, leading to increased selling pressure. With this in mind, the critical question now is how much further this bearish trend might extend.
Technical Analysis
By Shayan
The Daily Chart
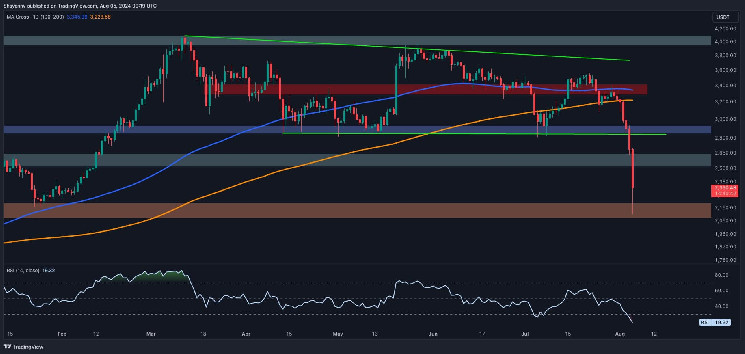
A detailed examination of Ethereum’s daily chart reveals that the cryptocurrency market has been under intense selling pressure due to widespread concerns over a potential economic recession.
Since Friday, ETH has experienced a significant 37% drop, driven mainly by selling activity from smart money, likely aimed at managing market exposure and reducing risk. This decline has resulted in Ethereum breaking below several key support levels:
- The 100 and 200-day moving averages (MAs).
- The crucial $2.8K support level.
- The psychological $2.5K threshold.
This has triggered a cascade of long liquidations, leaving the market in a state of fear. However, the price has now landed on the critical $2.1K support region, which was the origin of the earlier bullish rally towards the $4K yearly high.
Given the sharpness of the recent downturn, a period of sideways consolidation near the $2.1K support level, followed by minor bullish corrections, is likely in the short term. This would allow the market to stabilize and “catch its breath” before any further significant moves.
The 4-Hour Chart
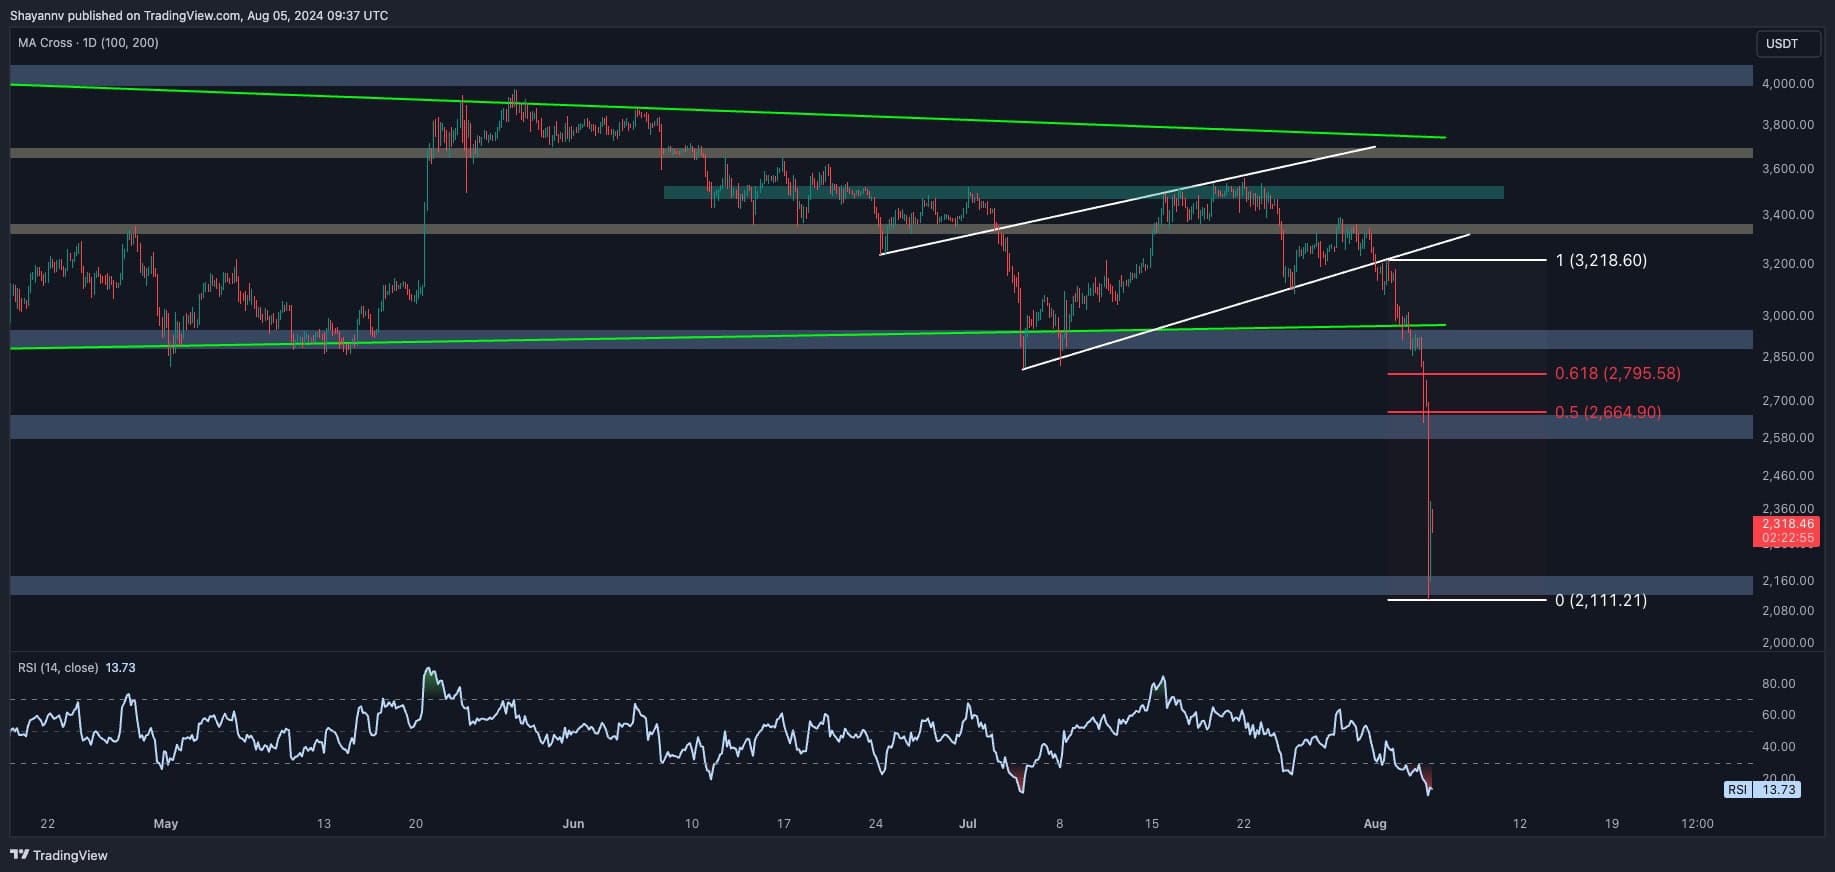
On the 4-hour chart, Ethereum shows clear signs of substantial selling pressure after breaking below the $2.8K wedge’s lower boundary. This breakdown likely triggered a significant long-squeeze, which amplified the bearish momentum, pushing the price through multiple support levels.
Currently, ETH has reached a decisive support region at the $2.1K mark. After such an impulsive bearish move, the market often enters a corrective phase to consolidate and possibly retrace.
Therefore, a period of consolidation and correction is expected in the near term, with key targets being the $2.5K level and the Fibonacci retracement zones (likely around 0.5 and 0.618 levels). However, traders should exercise caution during these volatile conditions and adhere strictly to their risk management strategies to navigate the market effectively.
Onchain Analysis
By Shayan
Analyzing the futures market metrics for Ethereum can indeed provide valuable insights into market sentiment, especially in conjunction with price analysis.
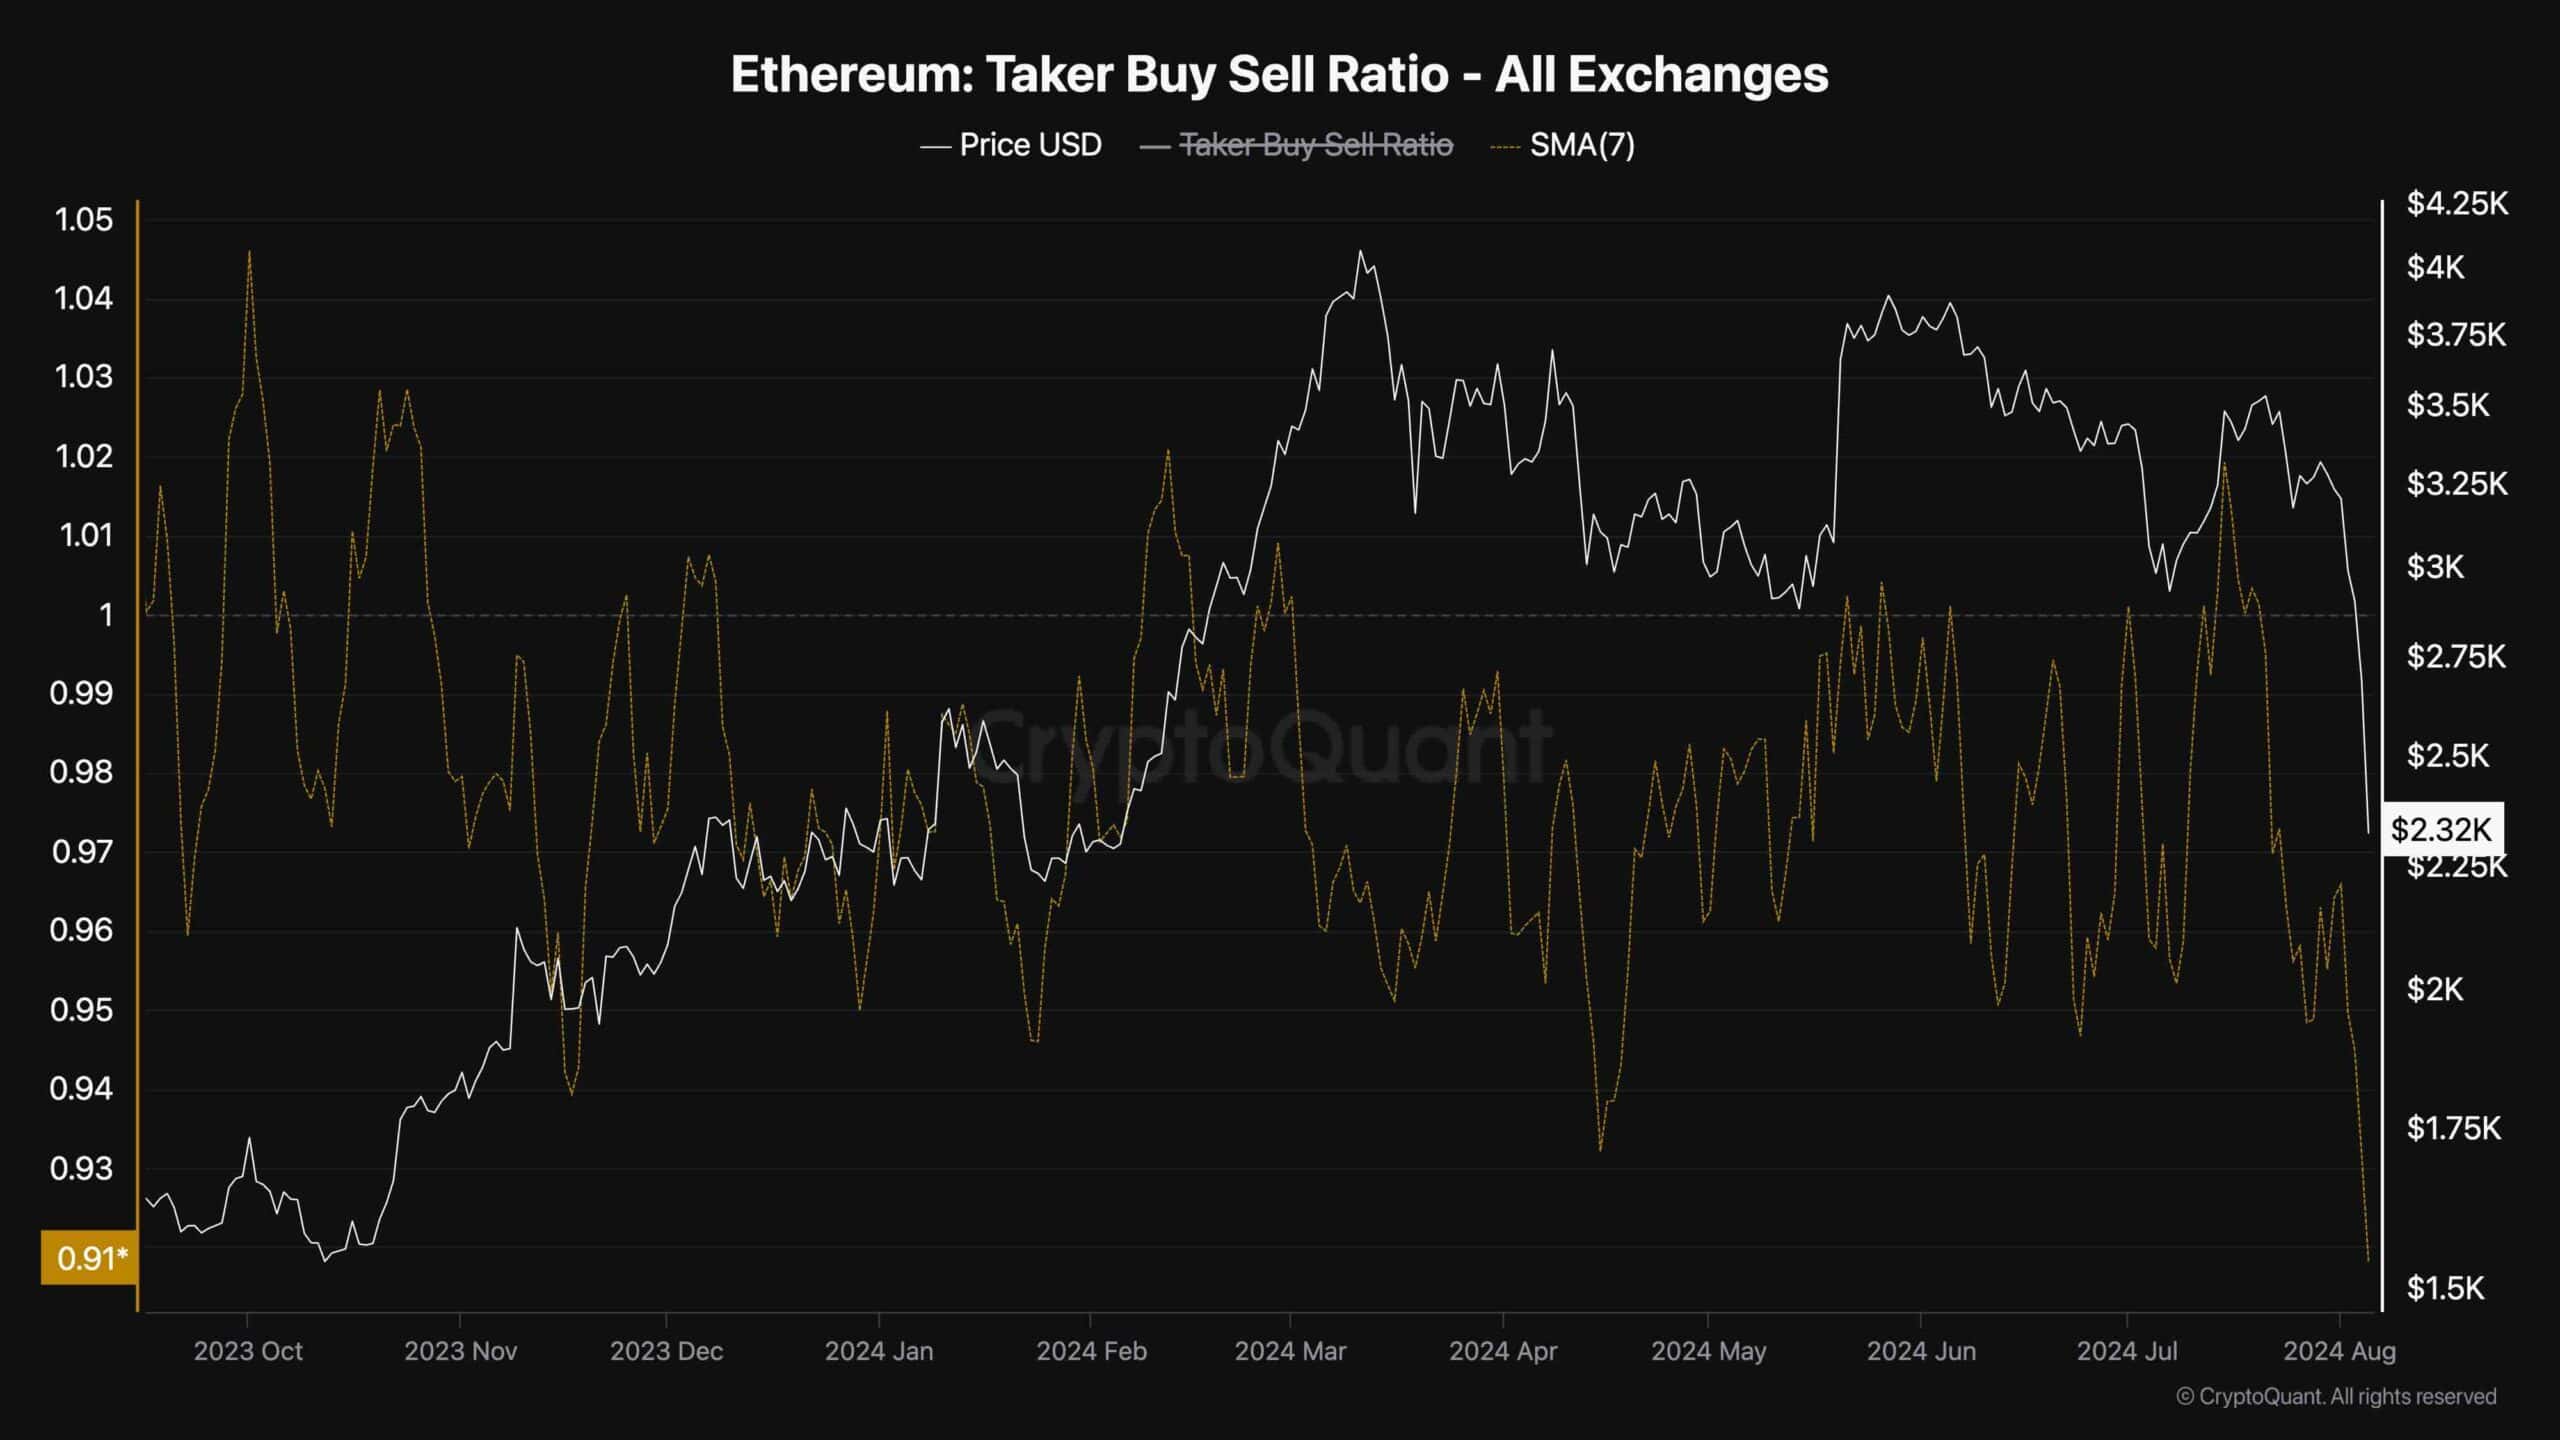
The Taker Buy/Sell Ratio is a critical metric that reflects whether buyers or sellers are more aggressive in the futures market. A ratio above 1 indicates buyers are dominant, while a ratio below 1 suggests sellers are taking the lead.
As depicted in the accompanying chart, Ethereum’s price has been under significant pressure after failing to break above the $3.5K level. The subsequent rejection from the $3K level has led to a sharp increase in market sell orders. This surge in selling activity has driven the Taker Buy/Sell Ratio to its lowest values since 2021, indicating strong bearish sentiment among futures market participants.
This bearish sentiment suggests that futures traders are anticipating further declines in Ethereum’s price in the short term. The persistent execution of sell orders indicates a lack of confidence in the market’s ability to sustain higher prices, which could lead to continued downward pressure. Therefore, unless there is a significant shift in market dynamics or a catalyst that reignites buying interest, the bearish trend may persist.