
Ethereum Technical Analysis: ETH Faces Bearish Momentum With Potential for Short-Term Recovery
 news.bitcoin.com 05 August 2024 15:37, UTC
 On August 5, 2024, ethereum’s price action has been dominated by strong bearish sentiment across multiple timeframes. While short-term consolidation suggests some indecision, the overall market indicators point towards continued downward pressure. With critical support levels approaching, traders should exercise caution as the market searches for stability.
Ethereum
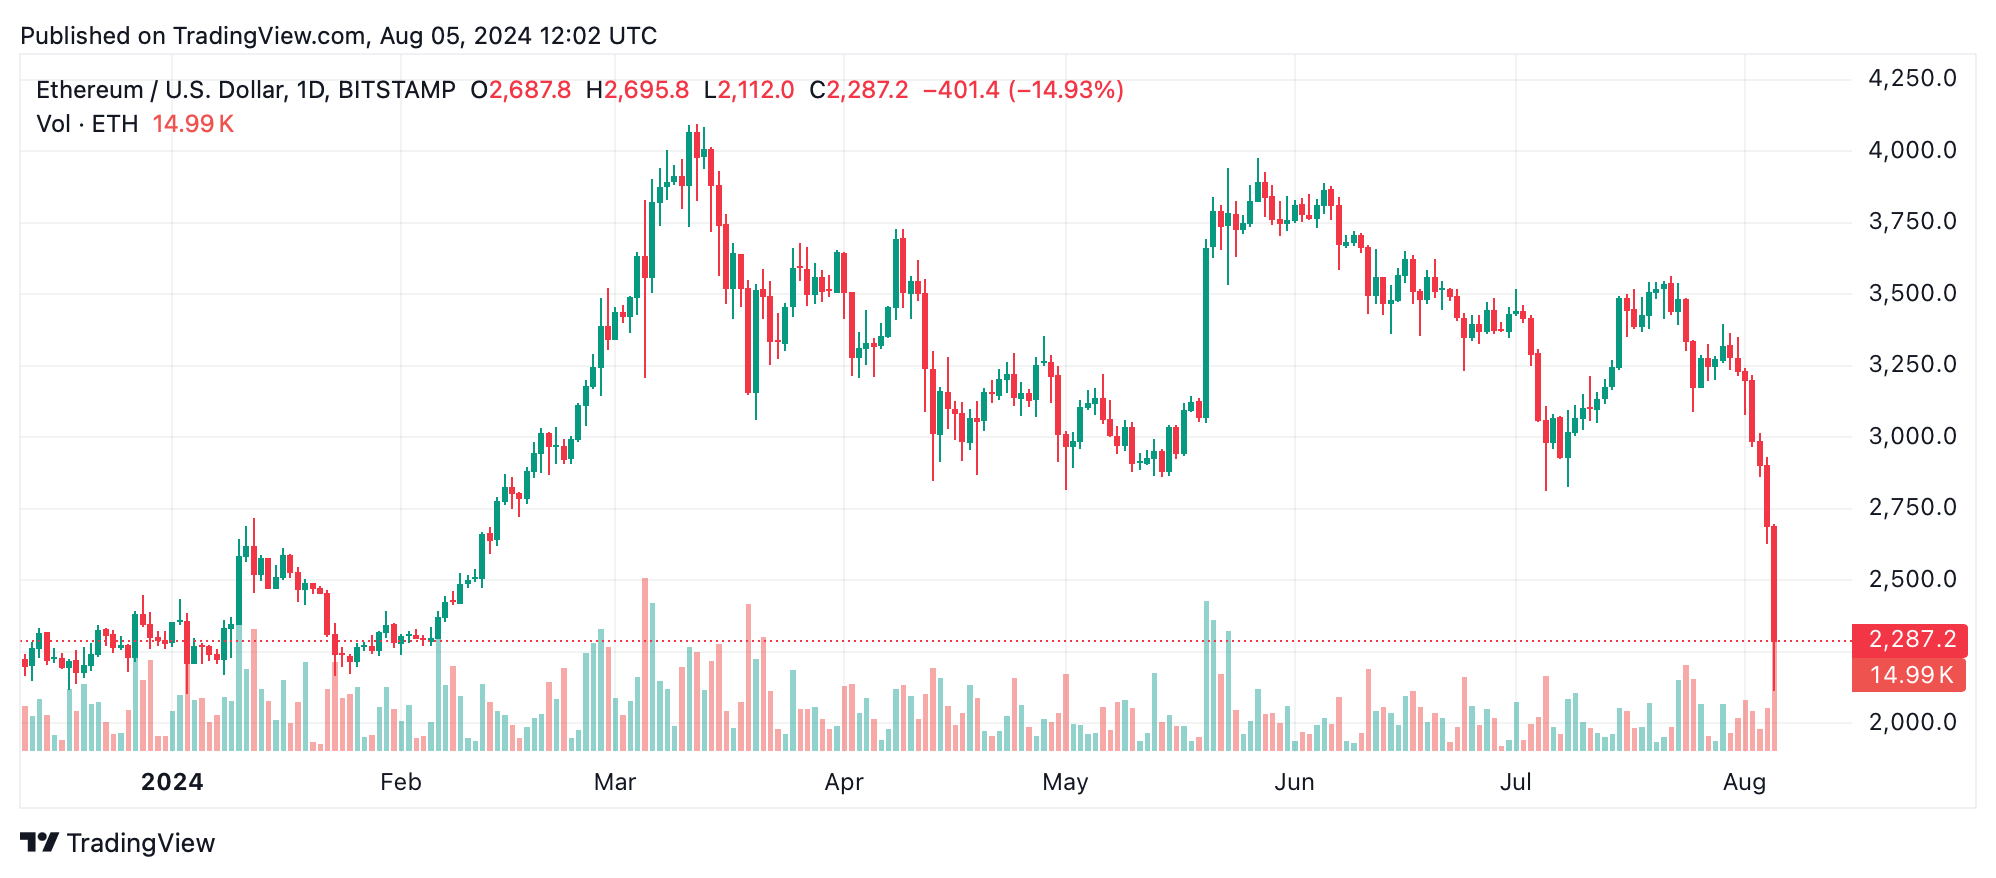
Ethereum’s price is facing significant downward pressure as revealed by the 1-hour, 4-hour, and daily charts. The 1-day chart indicates a pronounced downtrend, with the price having peaked at approximately $3,565 before declining to around $2,017. The strong selling activity, as evidenced by large red candles and a volume spike during the most significant drop, highlights the prevailing bearish sentiment. However, the price nears a key psychological support level of around $2,000, which could attract buyers and potentially slow down the descent.
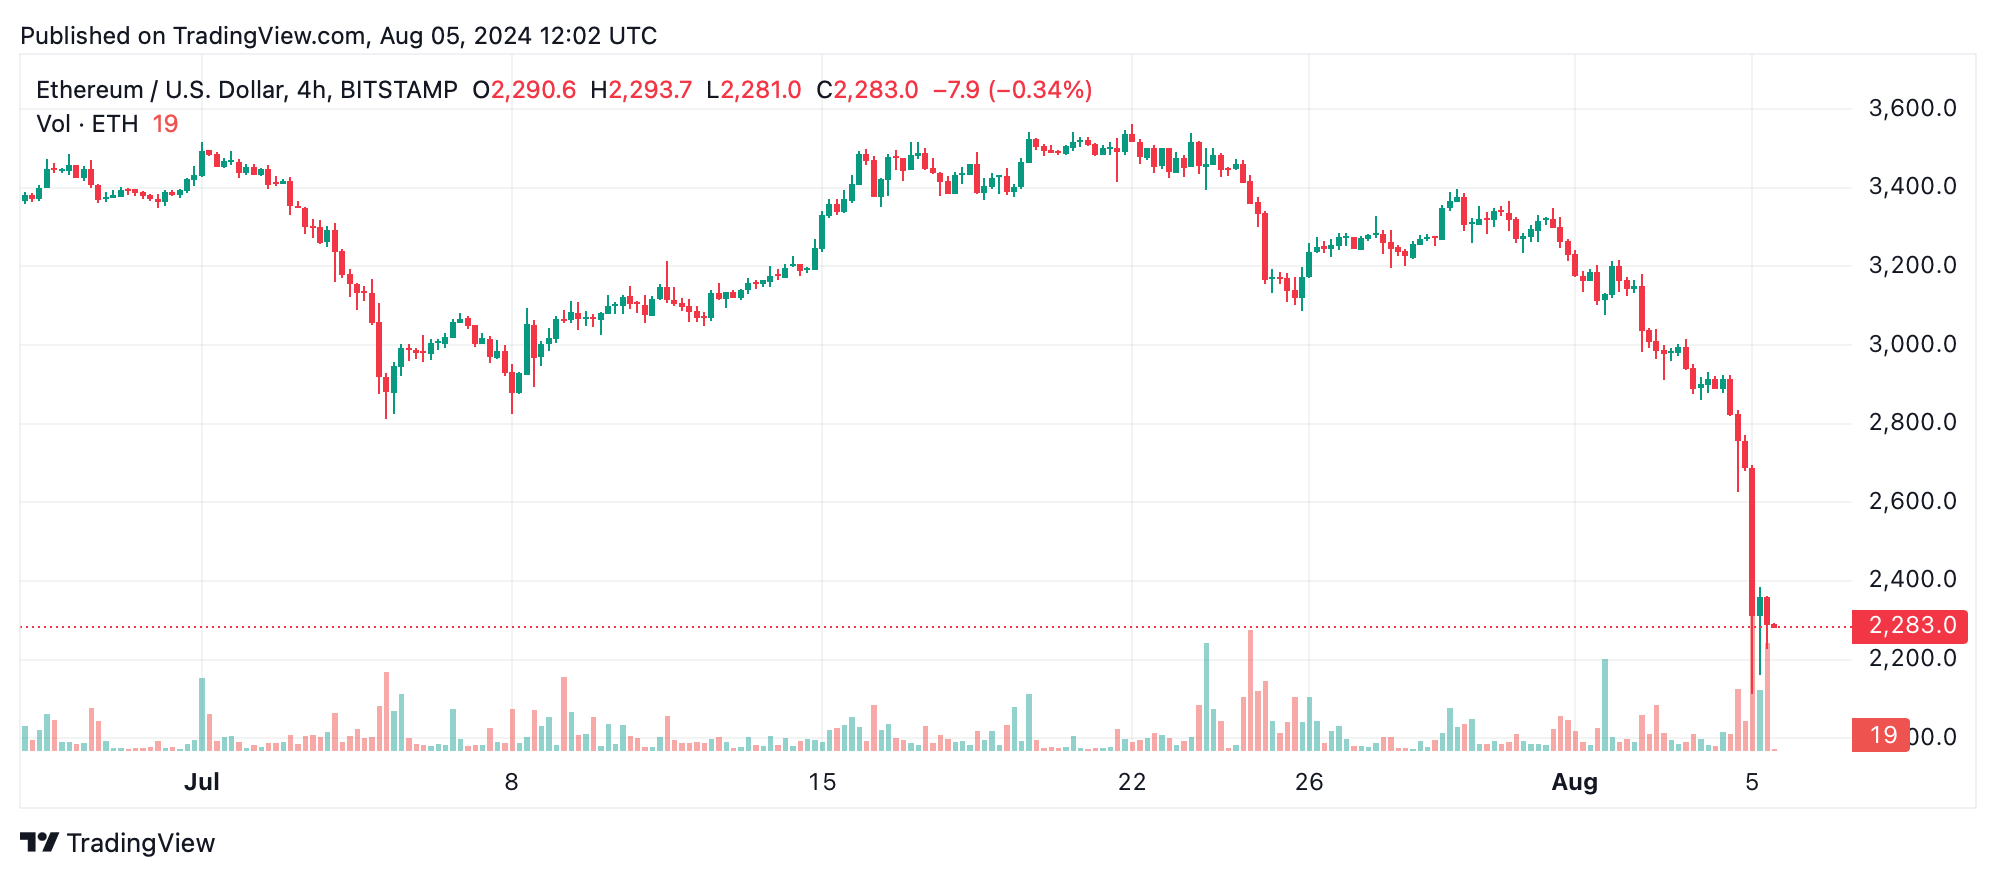
On the 4-hour chart, ethereum continues to exhibit a series of lower highs and lower lows, confirming the bearish momentum observed on the daily chart. The consistent volume spikes during sharp sell-offs may indicate panic selling or the triggering of stop-loss orders, suggesting that the market could be approaching an exhaustion point. A brief bounce from the $2,017 level hints at short-term support, but traders should be cautious as the overall trend remains negative.
The 1-hour chart offers a closer view of the recent price movements, showing a minor recovery after the price bottomed near $2,017. Despite the slight consolidation, the absence of significant reversal patterns suggests that the market has yet to find a clear direction. Elevated trading volumes during this phase indicate active market participation, possibly reflecting indecision among traders. This uncertainty could result in either a continuation of the downtrend or a potential short-term rebound if a bullish reversal pattern emerges.
Oscillators, including the relative strength index (RSI) and moving average convergence divergence (MACD), are largely neutral or indicate selling pressure, reinforcing the bearish outlook. The RSI, inferred from the sharp drop, suggests that ethereum could be nearing oversold territory, which might prompt a temporary relief rally. However, the MACD and momentum indicators suggest a continuation of the bearish trend, with the latter signaling a strong sell.
Moving averages (MAs) across various timeframes overwhelmingly support the bearish outlook. All key moving averages, from the 10-period exponential moving average (EMA) to the 200-period simple moving average (SMA), are positioned above the current price, signaling further downside risk. The confluence of these averages above the price level emphasizes the strength of the current downtrend, with any attempts at recovery likely facing significant resistance.
Bull Verdict:
If ethereum can hold the $2,000 support level and form a bullish reversal pattern, there is potential for a relief rally toward $2,300-$2,400. A sustained recovery could pave the way for further upside, particularly if accompanied by increasing volume and bullish momentum on lower timeframes.
Bear Verdict:
The prevailing downtrend remains strong, with all indicators pointing to continued bearish pressure. A break below the $2,000 support level could trigger another wave of selling, pushing ethereum to new lows. Traders should remain cautious, as the path of least resistance appears to be downward.


