
Litecoin (LTC) Bounces 12% Post-Sell-Off, but Downward Pressure Remains
 beincrypto.com 06 August 2024 10:44, UTC
 During the early trading session on Tuesday, Litecoin (LTC) saw a 12.16% price surge to reach a temporary high of $58.96. This marked the altcoin’s largest single-day gain since March 29. The rally comes as a relief for LTC holders following Monday’s market-wide decline.
However, despite the short-term uptick, an assessment of the LTC’s price movements on a 12-hour chart suggests that the coin may continue to face downward pressure.
Litecoin Bulls Remain Beaten Down
As of this writing, LTC trades at $58.29. While it has declined from the Tuesday morning high of $58.96, the coin has recorded a 10% price uptick in the past 24 hours. However, this rally merely mirrors the uptrend in the broader cryptocurrency market as the altcoin faces bearish headwinds.
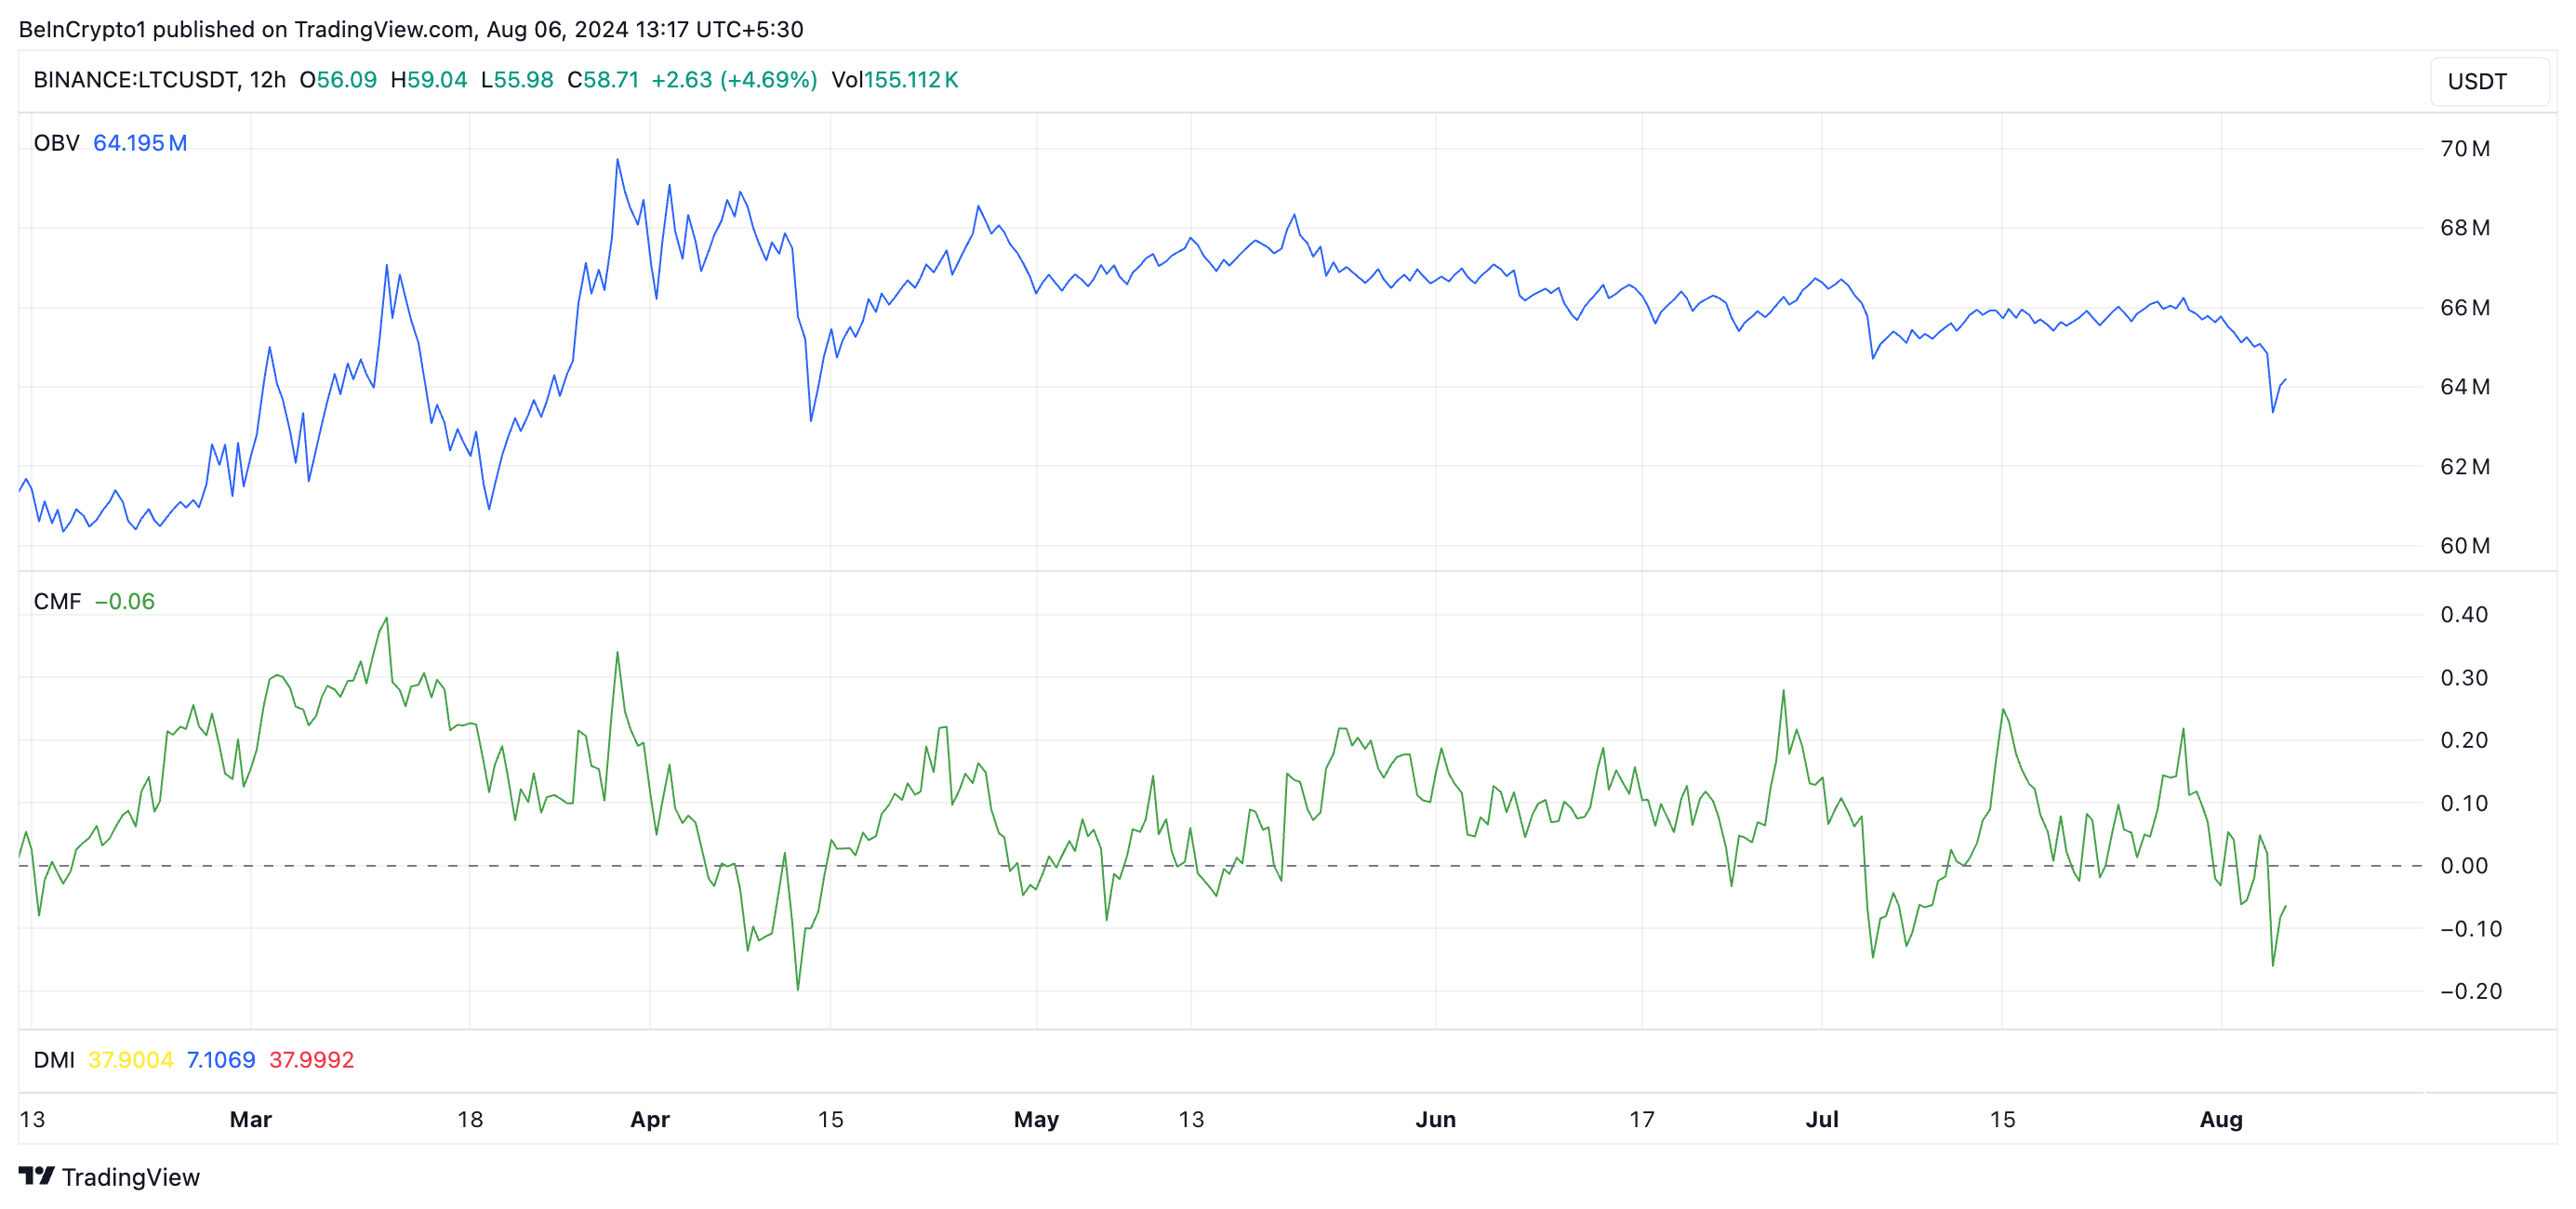
LTC’s declining On-Balance-Volume (OBV) confirms the decline in coin accumulation. This indicator measures buying and selling pressure in an asset’s market. When it decreases, it indicates that selling pressure outweighs buying pressure, hinting at a bearish trend.
Further, LTC’s Chaikin Money Flow (CMF) remains below the zero line. This indicator measures how money flows into and out of an asset’s market. At -0.07 at press time, the coin’s CMF signals increased liquidity exit from the market. A negative CMF value suggests market weakness and is often a precursor to a sustained price decline.
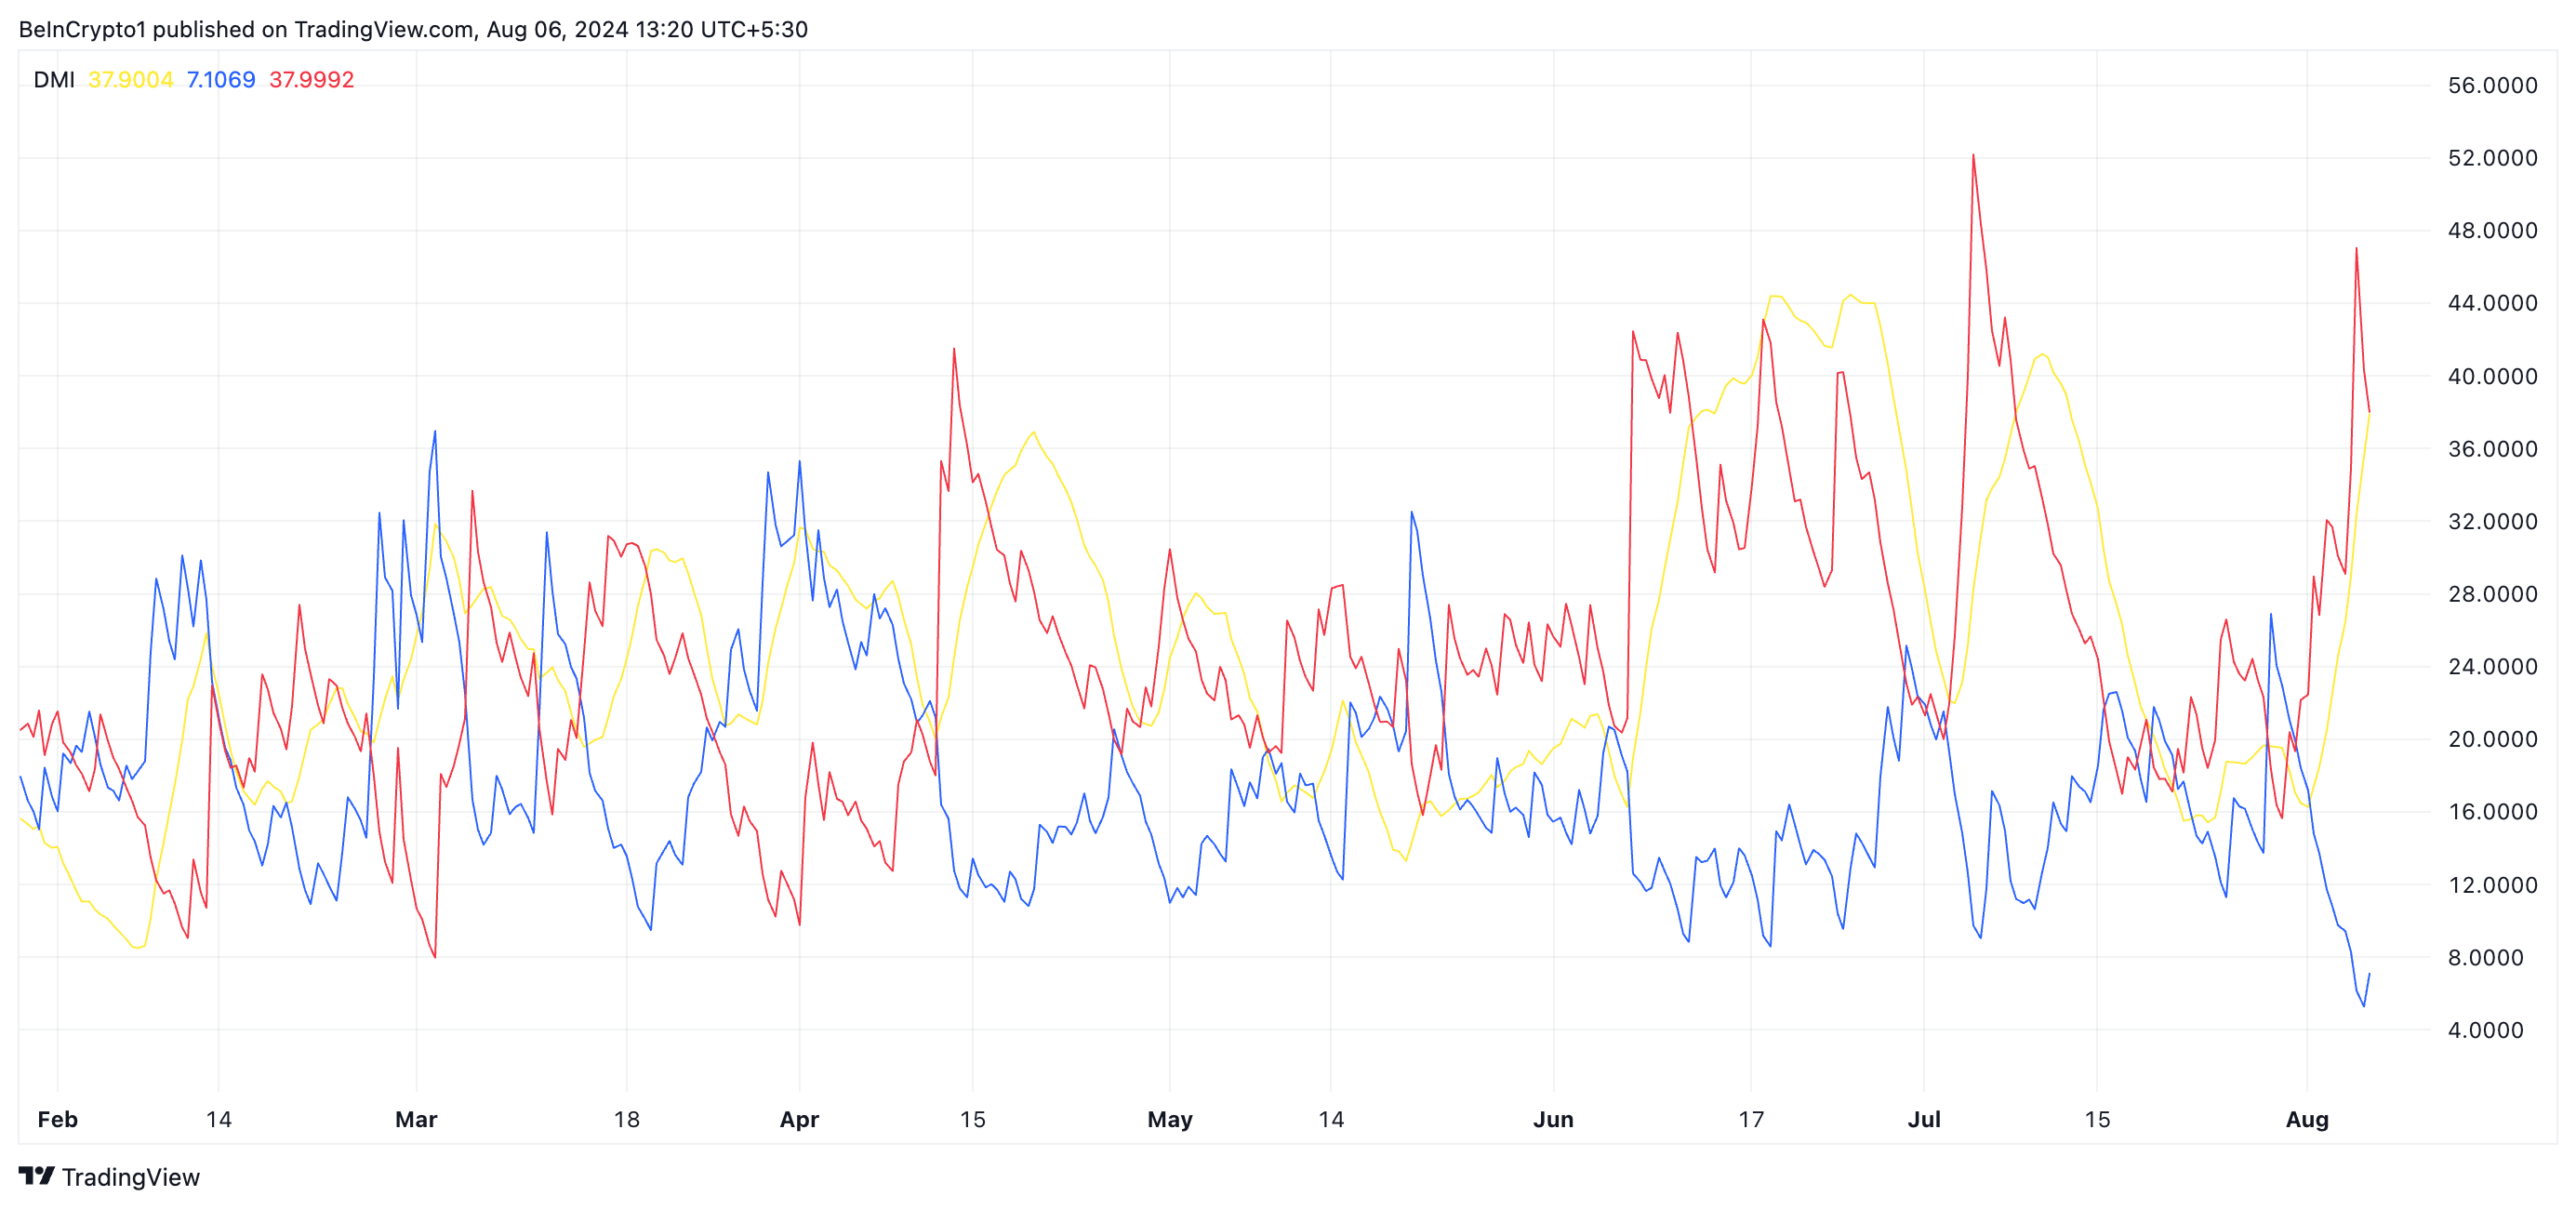
Additionally, readings from LTC’s Directional Movement Index (DMI) show its positive directional indicator (+DI) (blue) resting below its negative directional indicator (-DI) (red).
An asset’s DMI measures the strength and direction of a trend. When the +DI is under the -DI, it suggests that the downtrend is stronger than the uptrend. It indicates the presence of bearish market conditions, where selling pressure dominates, and the asset is likely to continue its downtrend.
Moreover, LTC’s ADX (Average Directional Index) (yellow), which measures the overall strength of the trend, regardless of direction, is at 37.90 at press time. When this line is above 20, the market trend is said to be strong.
Read More: Litecoin (LTC) Price Prediction 2024/2025/2030
Therefore, LTC bulls might find it challenging to initiate a shift away from the current bearish trend in the near term.
LTC Price Prediction: Will the Coin Revisit its Two-Year Low?
Monday’s market downturn led LTC to close at a two-year low of $50. If the prevailing bearish sentiment intensifies and it loses its recent gains, its price may revisit this level or drop further, potentially trading at $49.96.
Read More: How To Buy Litecoin (LTC) and Everything You Need To Know
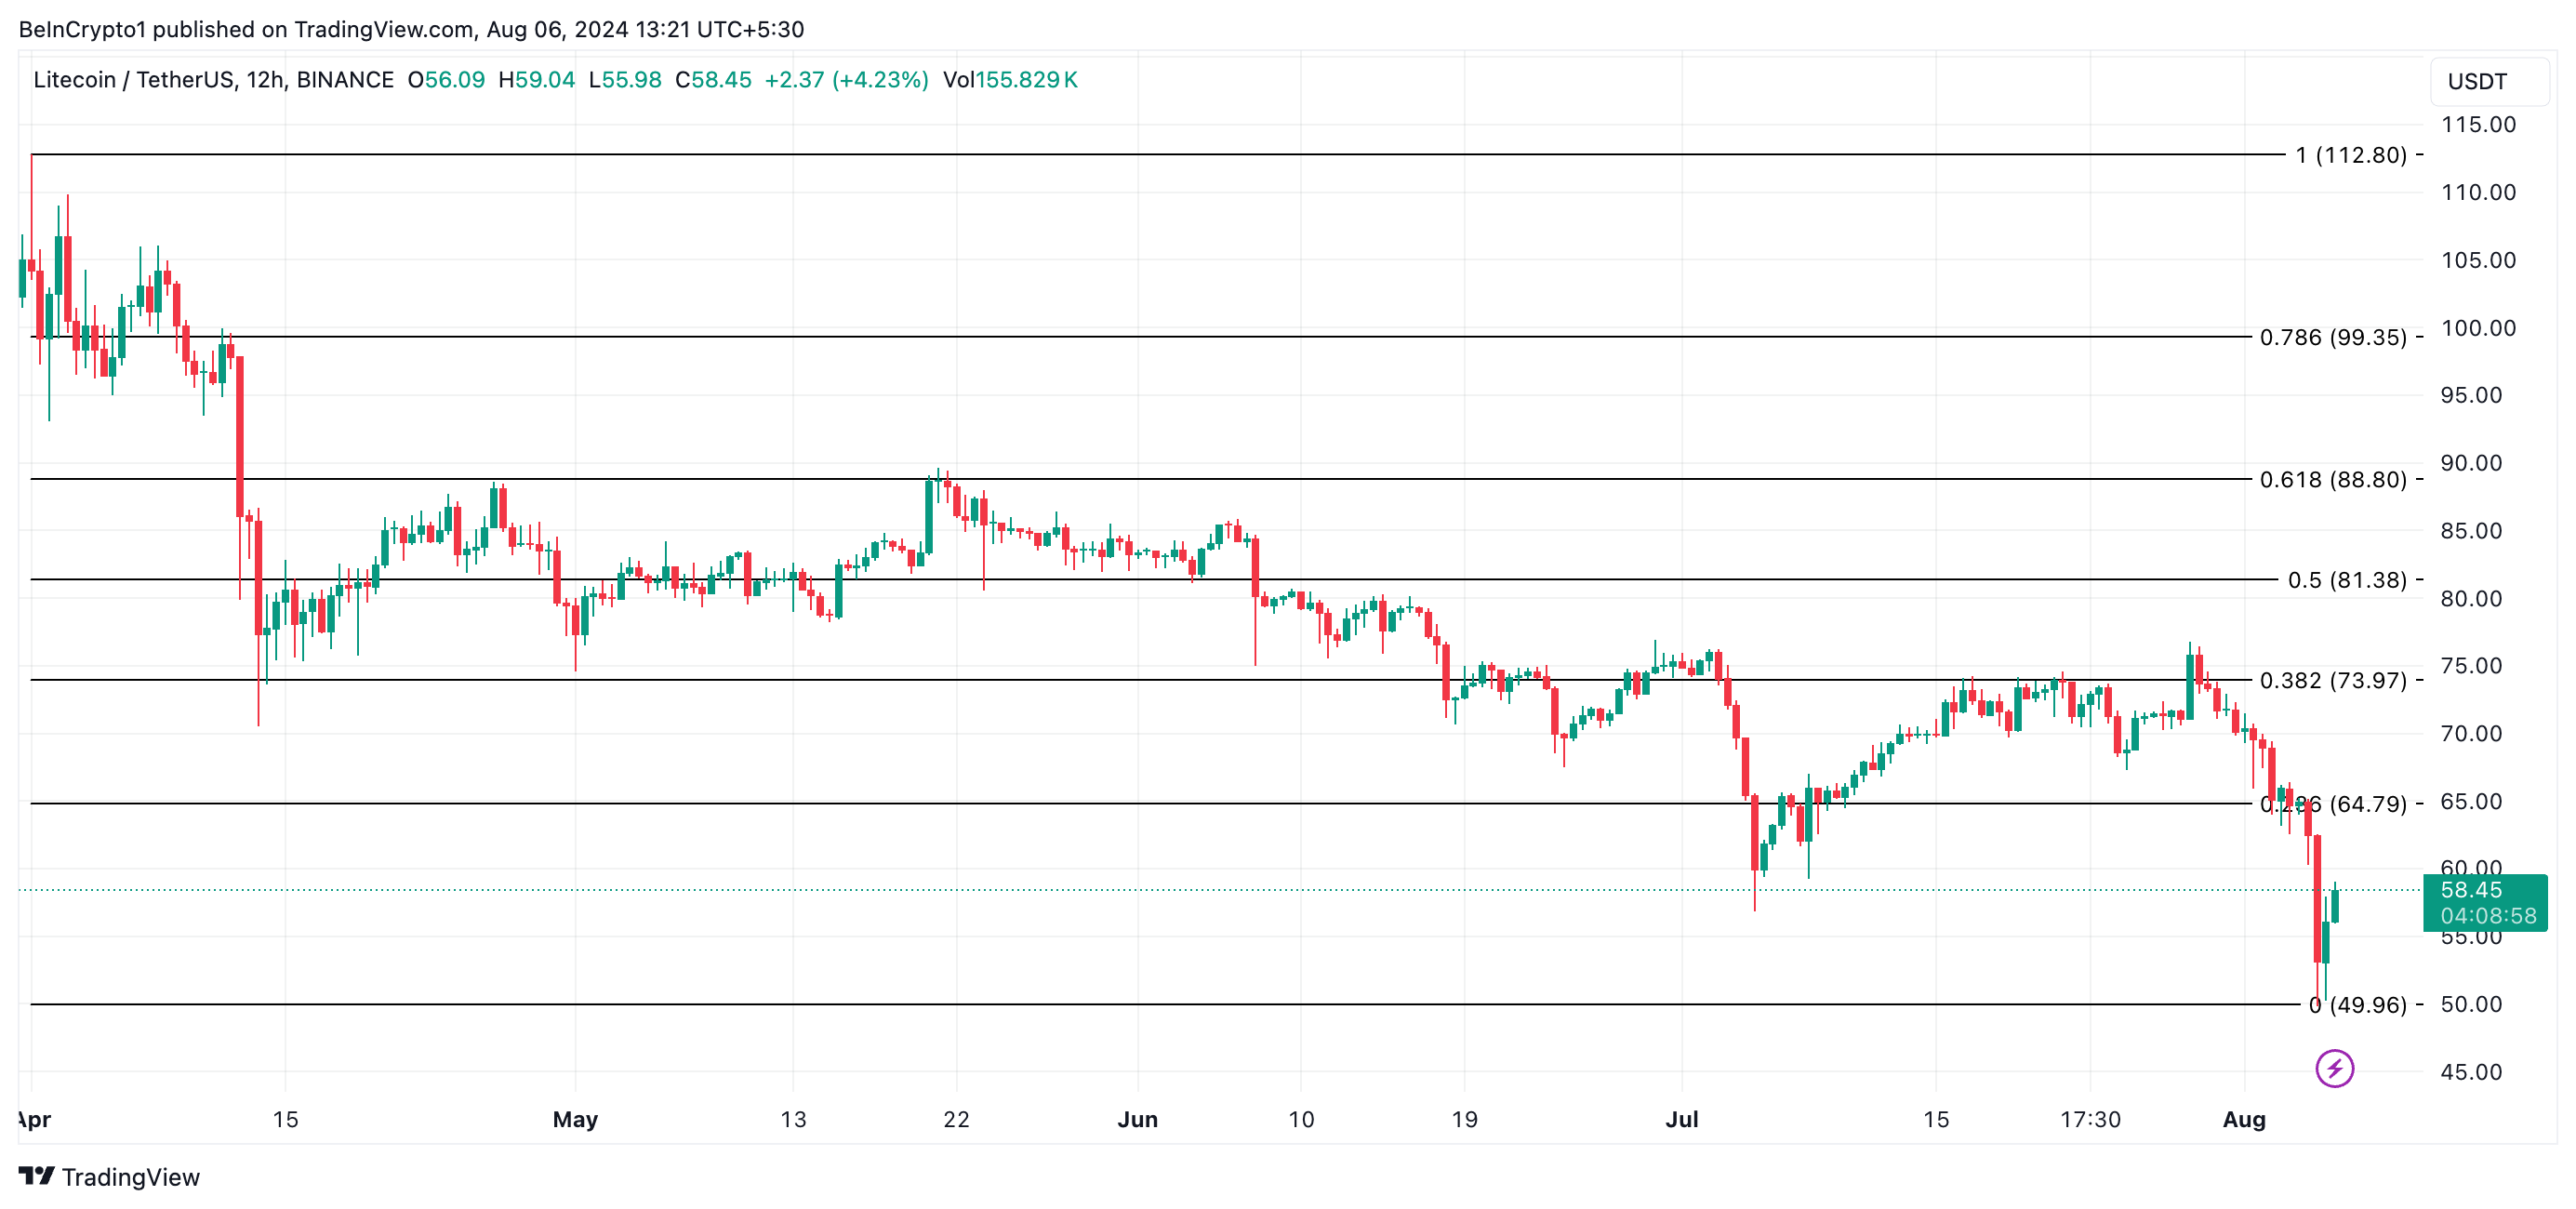
However, if market sentiment shifts and the bulls regain control, LTC’s price may climb to $64.79.


