ONDO Price Shows Signs Of Recovery With 18% Surge: What’s Next?
 thecoinrepublic.com 06 August 2024 20:30, UTC
 The ONDO price declined by over 55% in the last three weeks amid global woes and sentiment. A shift in the wind has been witnessed as the price showed a liquidity grab near a demand zone, signifying impulsive buying gestures.
When writing, the price traded at $0.7243, with an intraday surge of 18%. Its market cap value was $1.005 Billion. This made it the 60th largest cryptocurrency in terms of market cap globally, dominating at 0.04%.
Also, a surge of 81% in the spot traded volume was recorded, which resulted in a traded value of $406.9 Million. This led to a massive volume/market cap ratio of 41.21%, exhibiting high liquidity in the asset.
From the beginning of February 2024, ONDO started to witness buying, followed by strong bullish sentiment among investors. This led to a more than 450% price surge in less than four months.
How Much Supply the Top Addresses Hold?
The ONDO floating supply was 13.89%, precisely 1.389 Billion ONDO from the total supply of 10.0 Billion. Additionally, as of writing, the fully diluted market cap of the token with respect to price was $7.189 Billion.
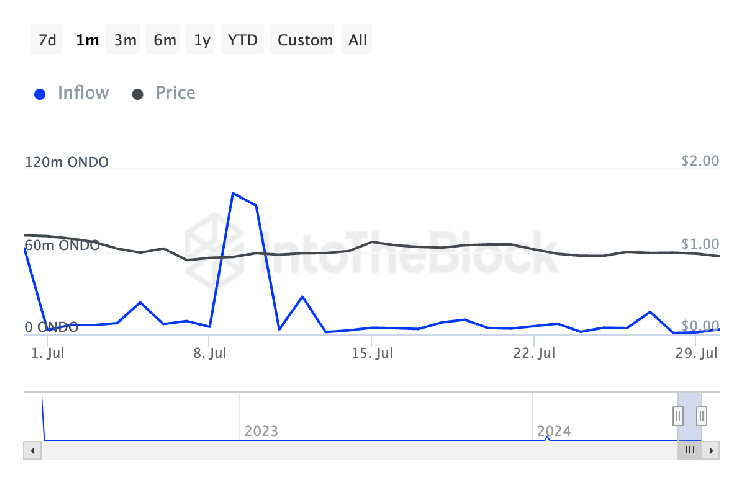
Ondo Finance had a massive adoption among its users per the CoinCarp. Its holders increased rapidly from a January low of 10,000 holder addresses to 58,277 holders at press time.
The top 10 holders held 86.75% of the total supply. Moreover, Ace in the rich list was the largest token holder, holding 75.89% of the supply (7.589 Billion ONDO tokens).
Decoding ONDO’s Next Move on Technical Chart
The ONDO price activity was in the upward wedge, where the low of all time was witnessed at $0.19655. The highest ever achieved was $1.48410.
On further look, the price had displayed a great uptrend. It got a major boost by mid-May 2024 from a symmetrical triangle pattern, hitting the $1.48 mark.
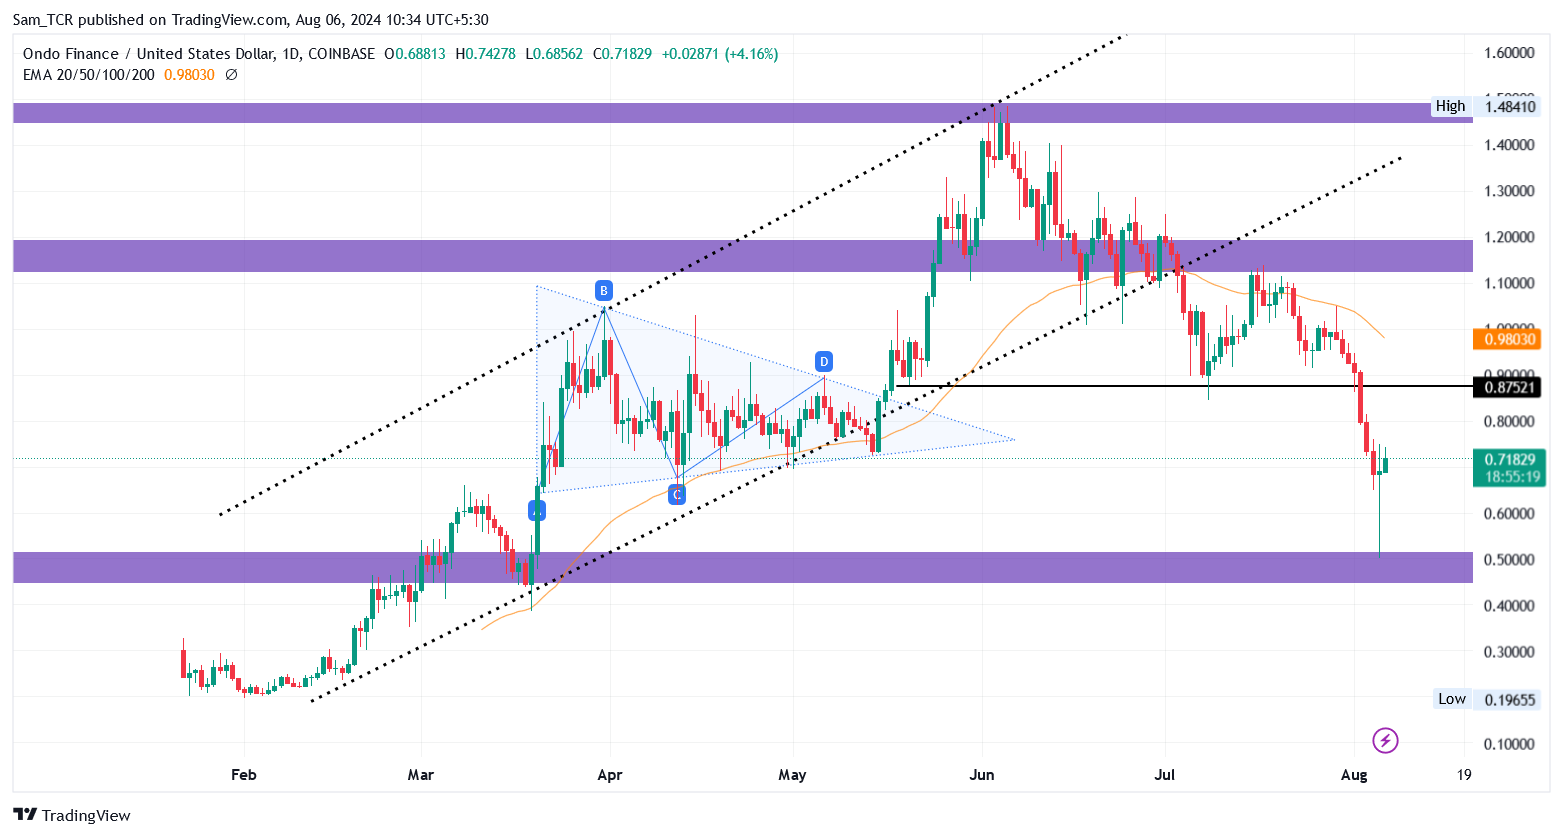
However, buyers lost strength from the supply level, which washed away its gains. The fall led to the formation of support at $0.87 by July 8th. The price tried to rise for a brief time, but the dynamic 50-day EMA hurdle deflected it downwards.
The overall sentiment turned bearish as its long followed-uptrend price structure in the upward channel became bearish. It formed a rising wedge, which was precisely a bearish pattern.
The fall accelerated in ONDO, with global woes, such as the recent crash of the South Korean and Japanese stock markets. It caused market leaders like BTC & ETH to draw down massively, which other altcoins depicted due to broader sentiment.
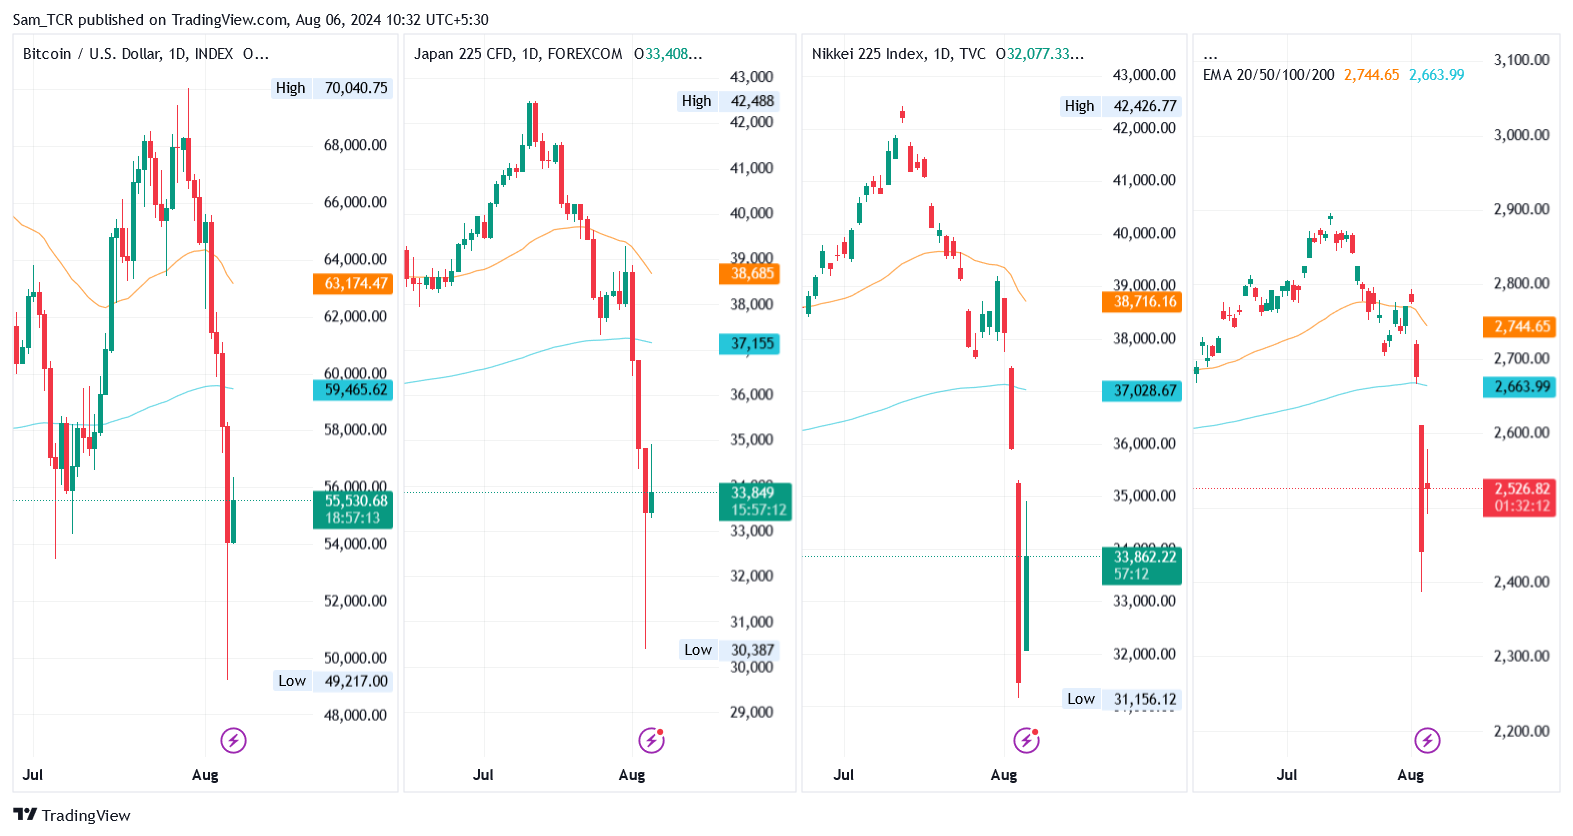
Despite the bearish sentiment, the hopes are alive as the ONDO increased from a historically proven support level on Aug 5th. Likewise, the broader market has shown a liquidity grab candle like ONDO, signifying massive buying occurred.
Indicator Perception and the ONDO Price Forcast
With the recently witnessed liquidity grab candle, bullishness has been identified. However, the bullish trend would be confirmed once ONDO reacquires the lost level of $0.875.
The EMA band of 50 days has been above the price, showcasing the price broadly in the bearish territory.
Despite that, the RSI has witnessed a resurgence from extremely oversold territory due to a liquidity grab built on the chart. It was last at 29.81.
Likewise, the MACD histogram has reduced toward the zero line. A bullish cross is anticipated based on a more bullish force.
Regarding ONDO price advancement, the resistance could be at $0.875 and $1.042, respectively. On the contrary, the loss of the demand zone would lead to a lower low, depending on the bears’ strength.


