Chainlink Jumps 27%, Analyst Predicts $50, Can It Manifest?
 thecoinrepublic.com 08 August 2024 03:20, UTC
 Chainlink (LINK) is the 16th-ranked crypto at press time, it rose 3.5% intraday. It rose 27% in the last 48 hours from a critical demand zone after a significant drop witnessed at the start of August. This shift in the wind was witnessed as a liquidity grab happened close to a demand zone.
When writing, the price was $10.22, with an intraday surge of 3%. LINK is up by 3% in market value, which reached $6.214 Billion, and its trading volume was $329.69 Million.
This made it the 16th largest intraday cryptocurrency in terms of market cap globally; this led to a moderate volume/market cap ratio of 5.30%, exhibiting moderate liquidity in the asset.
How Much Supply the Top Addresses Hold In Chainlink (LINK)?
Additionally, per its tokenomics, there were 608.09 million LINKs in circulation, which made 60.8% out of the total of 10 Billion coins. As of writing, the fully diluted market cap of the coin with respect to price was $10.18 Billion.
According to the Coincarp, the userbase seems strong with massive adoption witnessed via the graph over the 1-year period. Its holders increased rapidly from an August low of 670,448 holder addresses to 723,253 holders at press time.
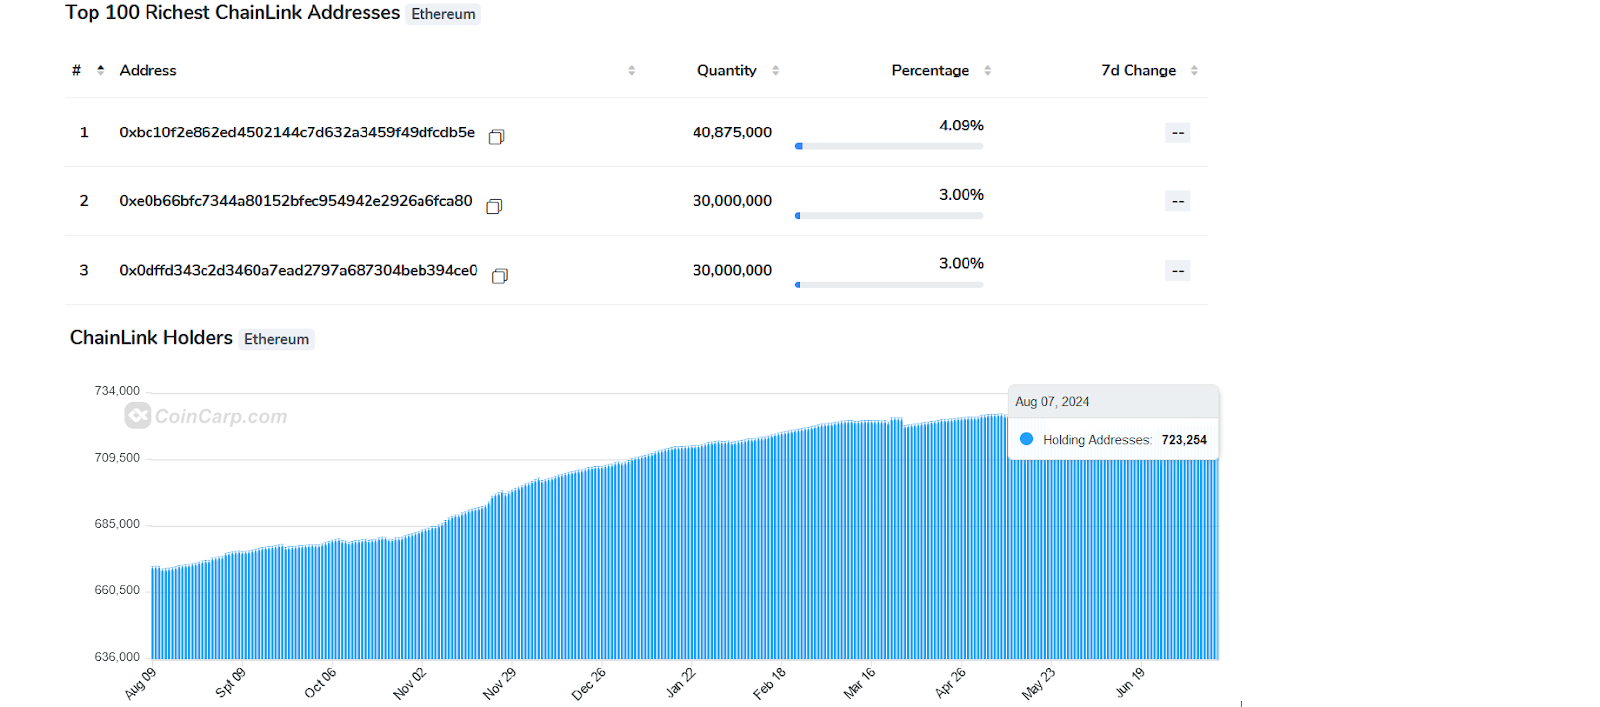
The top 10 holders held 31.09% of the total supply, and over a broader view, the top 100 addresses held 68.45% of the floating supply. Moreover, Ace in the rich list holds 40.87 Million LINKs holding 4.09% of the floating circulatory supply.
Global Market Fear Needled High, Despite Gains: Why?
Earlier, most cryptos, along with LINK, were bear targets that increased sell-offs. Most cryptocurrencies follow the BTC’s movement and activity. If a market leader’s sentiment happens to be optimistic, it influences investors’ sentiments and brings positive feedback, and the price starts to show optimism.
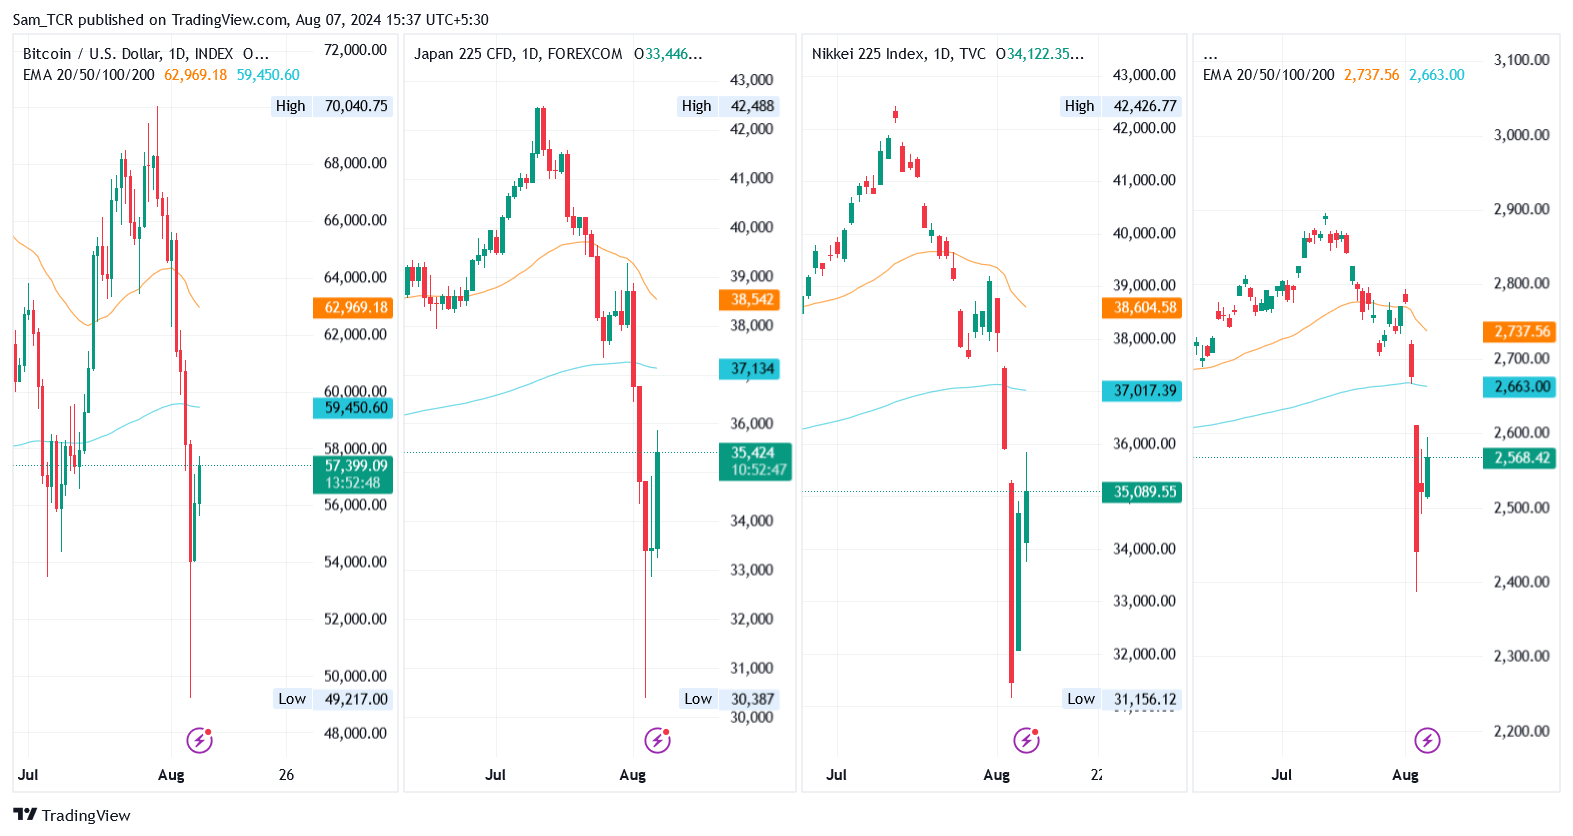
Lately, the global market indicated higher chances of robust bull sentiment after the fall. And, many must have taken advantage of the buy-the-dip phenomenon, leading to a liquidity grab. Correspondingly, the liquidity grab candle was influenced by the broader market, consisting of BTC and several stock markets.
But for the bullish trend to start once again, getting past the $15 mark is important.
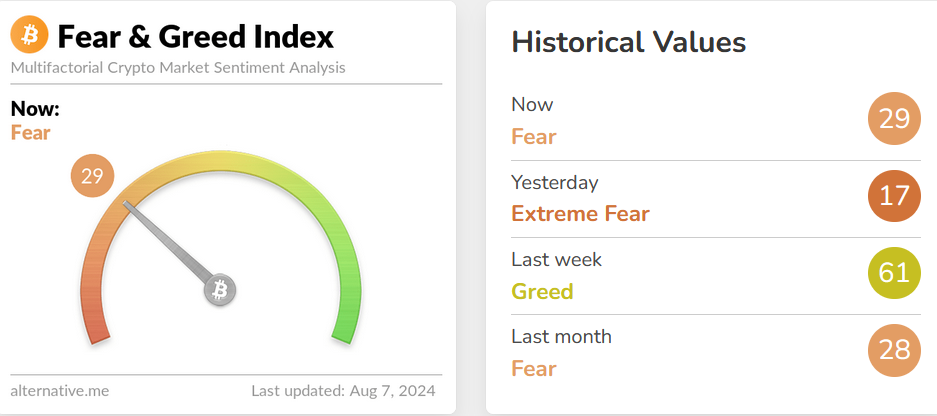
The fear and greed index points at 29, representing fear. Since, some have chosen the bullish side, the needle has improved from yesterdays extreme fear(17) to the current one.
What is the Top Analyst’s Take on Chainlink (LINK)?
An optimistic tweet post on X was shared by one of the analysts. Where the analyst @WorldOfCharts1 shared one of his chart drawings of LINK price for the X community.
Where he shared that it could go 5x beyond $50 based on bulls’ sentiment. He also added that LINK happens to be testing the crucial multi-year support area. Similarly, a successful retest can send the link toward a new ATH in the coming months.
$Link
Testing The Crucial Multi-Year Support Area, A Successful Retest Can Send The Link Towards A New All-Time High In The Coming Months. Adding More #Link Here For The Mid-Term pic.twitter.com/YuDSDxCFU9
— World Of Charts (@WorldOfCharts1) August 7, 2024
The analyst wishes to go in for the Mid-term. So, investors must be prepared, avoid FOMO, and be cautious before stepping in (DYOR).
LINK Forecast and Indicators Resolve
The major indicators signifying bearishness, as EMA bands showed price traded below the death cross, and MACD showed a bearish cross. However, the RSI showed a resurgence from oversold territory, where it flashed at 31.04.
Therefore, the resistance is at $15 and $17, which is followed by the supports of $8 and $6, respectively.


