
Ripple traders shed XRP holdings at nearly $40 million losses, XRP holds steady above $0.50
 fxstreet.com 08 August 2024 07:16, UTC
 - Ripple traders shed their holdings at nearly $40 million loss in the crypto market crash on Monday.
- XRP noted a decline in address activity as traders lost interest after mass sell-off.
- XRP sustained above $0.50 on August 7, nearly a 10% decline is likely.
Ripple (XRP) made a comeback above key support at $0.50 after the recent correction in the crypto market. On-chain data shows traders losing interest in the altcoin after a massive sell-off event on August 5.
Santiment data shows traders realized millions in losses, a likely sign of capitulation.
Daily digest market movers: Ripple traders dump holdings at a loss
- Santiment data shows Ripple holders shed their XRP at $38.3 million in losses on Wednesday, the single largest capitulation event in the altcoin since May 1, 2024.
- The Network Realized Profit/Loss metric measures the net profit/loss realized by all traders who moved the asset on a given day. The large negative spike on August 5 is, therefore, indicative of the losses realized on the day of the massive crypto crash on Monday.
- XRP traders have realized gains since then, per NPL data from Santiment.
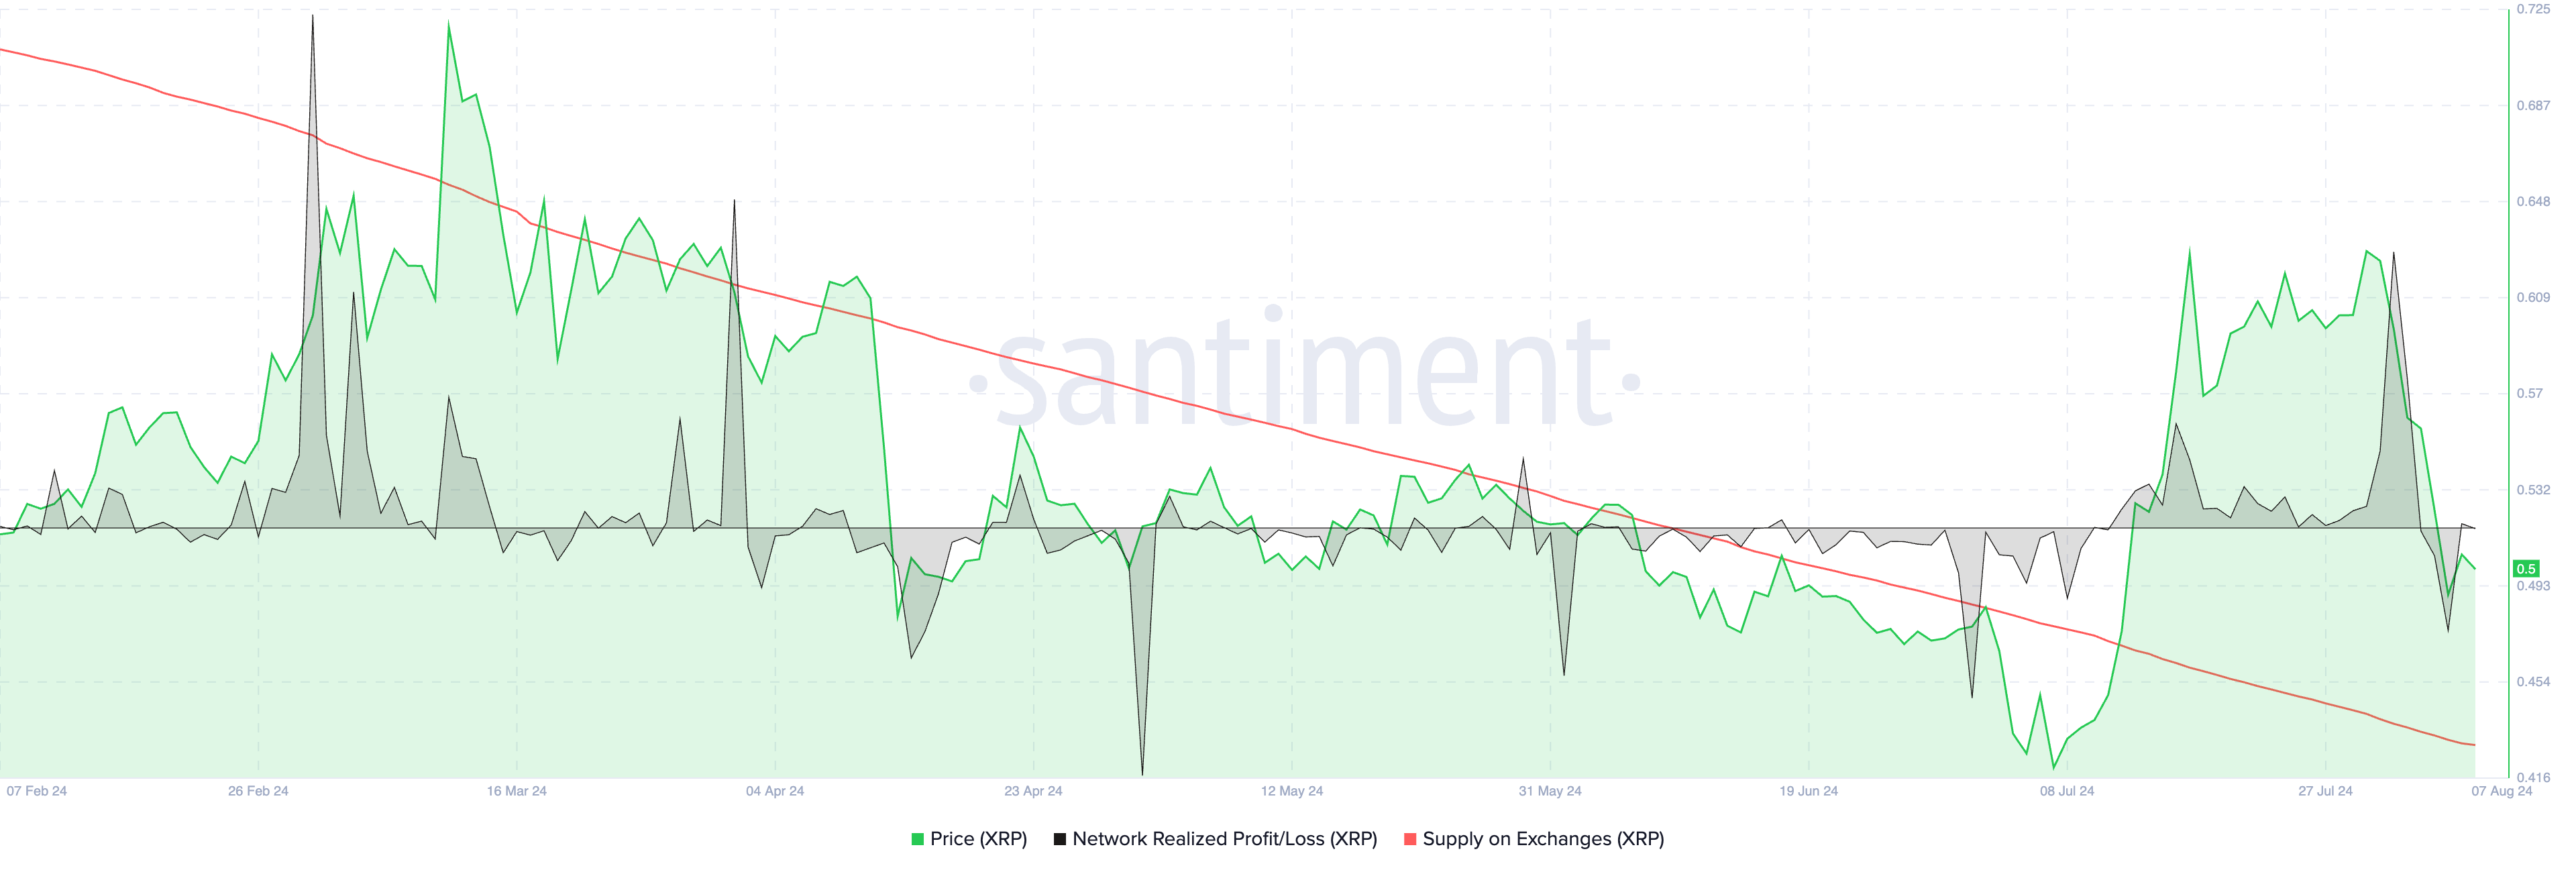
XRP NPL vs. price
- The address activity metric used to track demand for the asset and trader interest shows a decline since the correction. This supports a bearish thesis for the asset, per Santiment data.
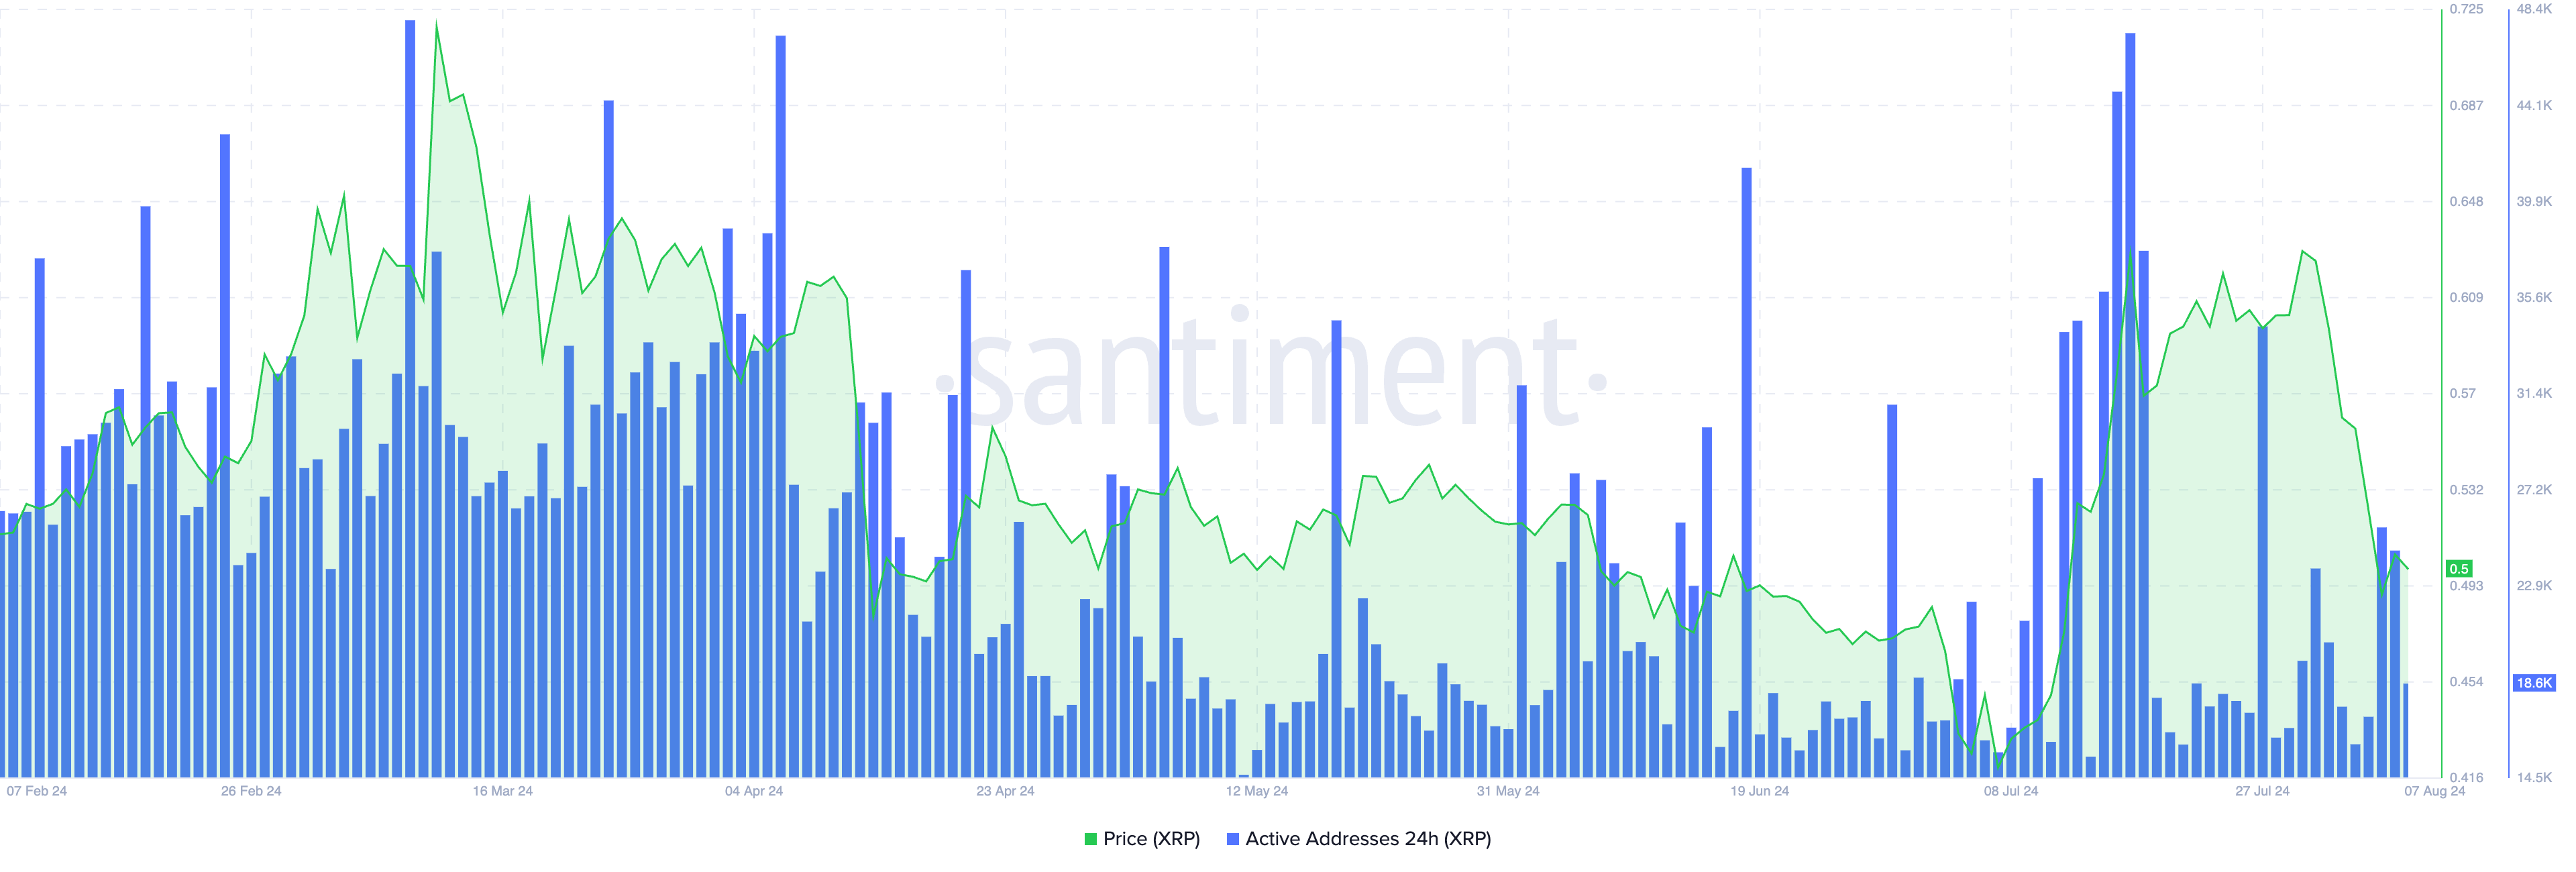
XRP active addresses vs. price
- Ripple announced its $10 million investment in tokenized US Treasury bills, RippleX Bug Bounty Program and partnership with DIFC Innovation Hub. Despite the series of positive announcements, the altcoin’s price remains stuck around the resistance at $0.50.
Technical analysis: XRP could extend losses by nearly 10%
Ripple is in a downward trend that started on July 19, 2023, and since then the asset has attempted to break out of the decline, with no success. XRP slipped to a low of $0.43 on August 5 and recovered above $0.50 early on Wednesday.
The Moving Average Convergence Divergence (MACD) indicator shows red histogram bars under the neutral line, meaning the underlying momentum in Ripple price is negative. XRP could extend losses by nearly 10% and slip to $0.45, the lower boundary of a Fair Value Gap (FVG) seen in the XRP/USDT daily chart.
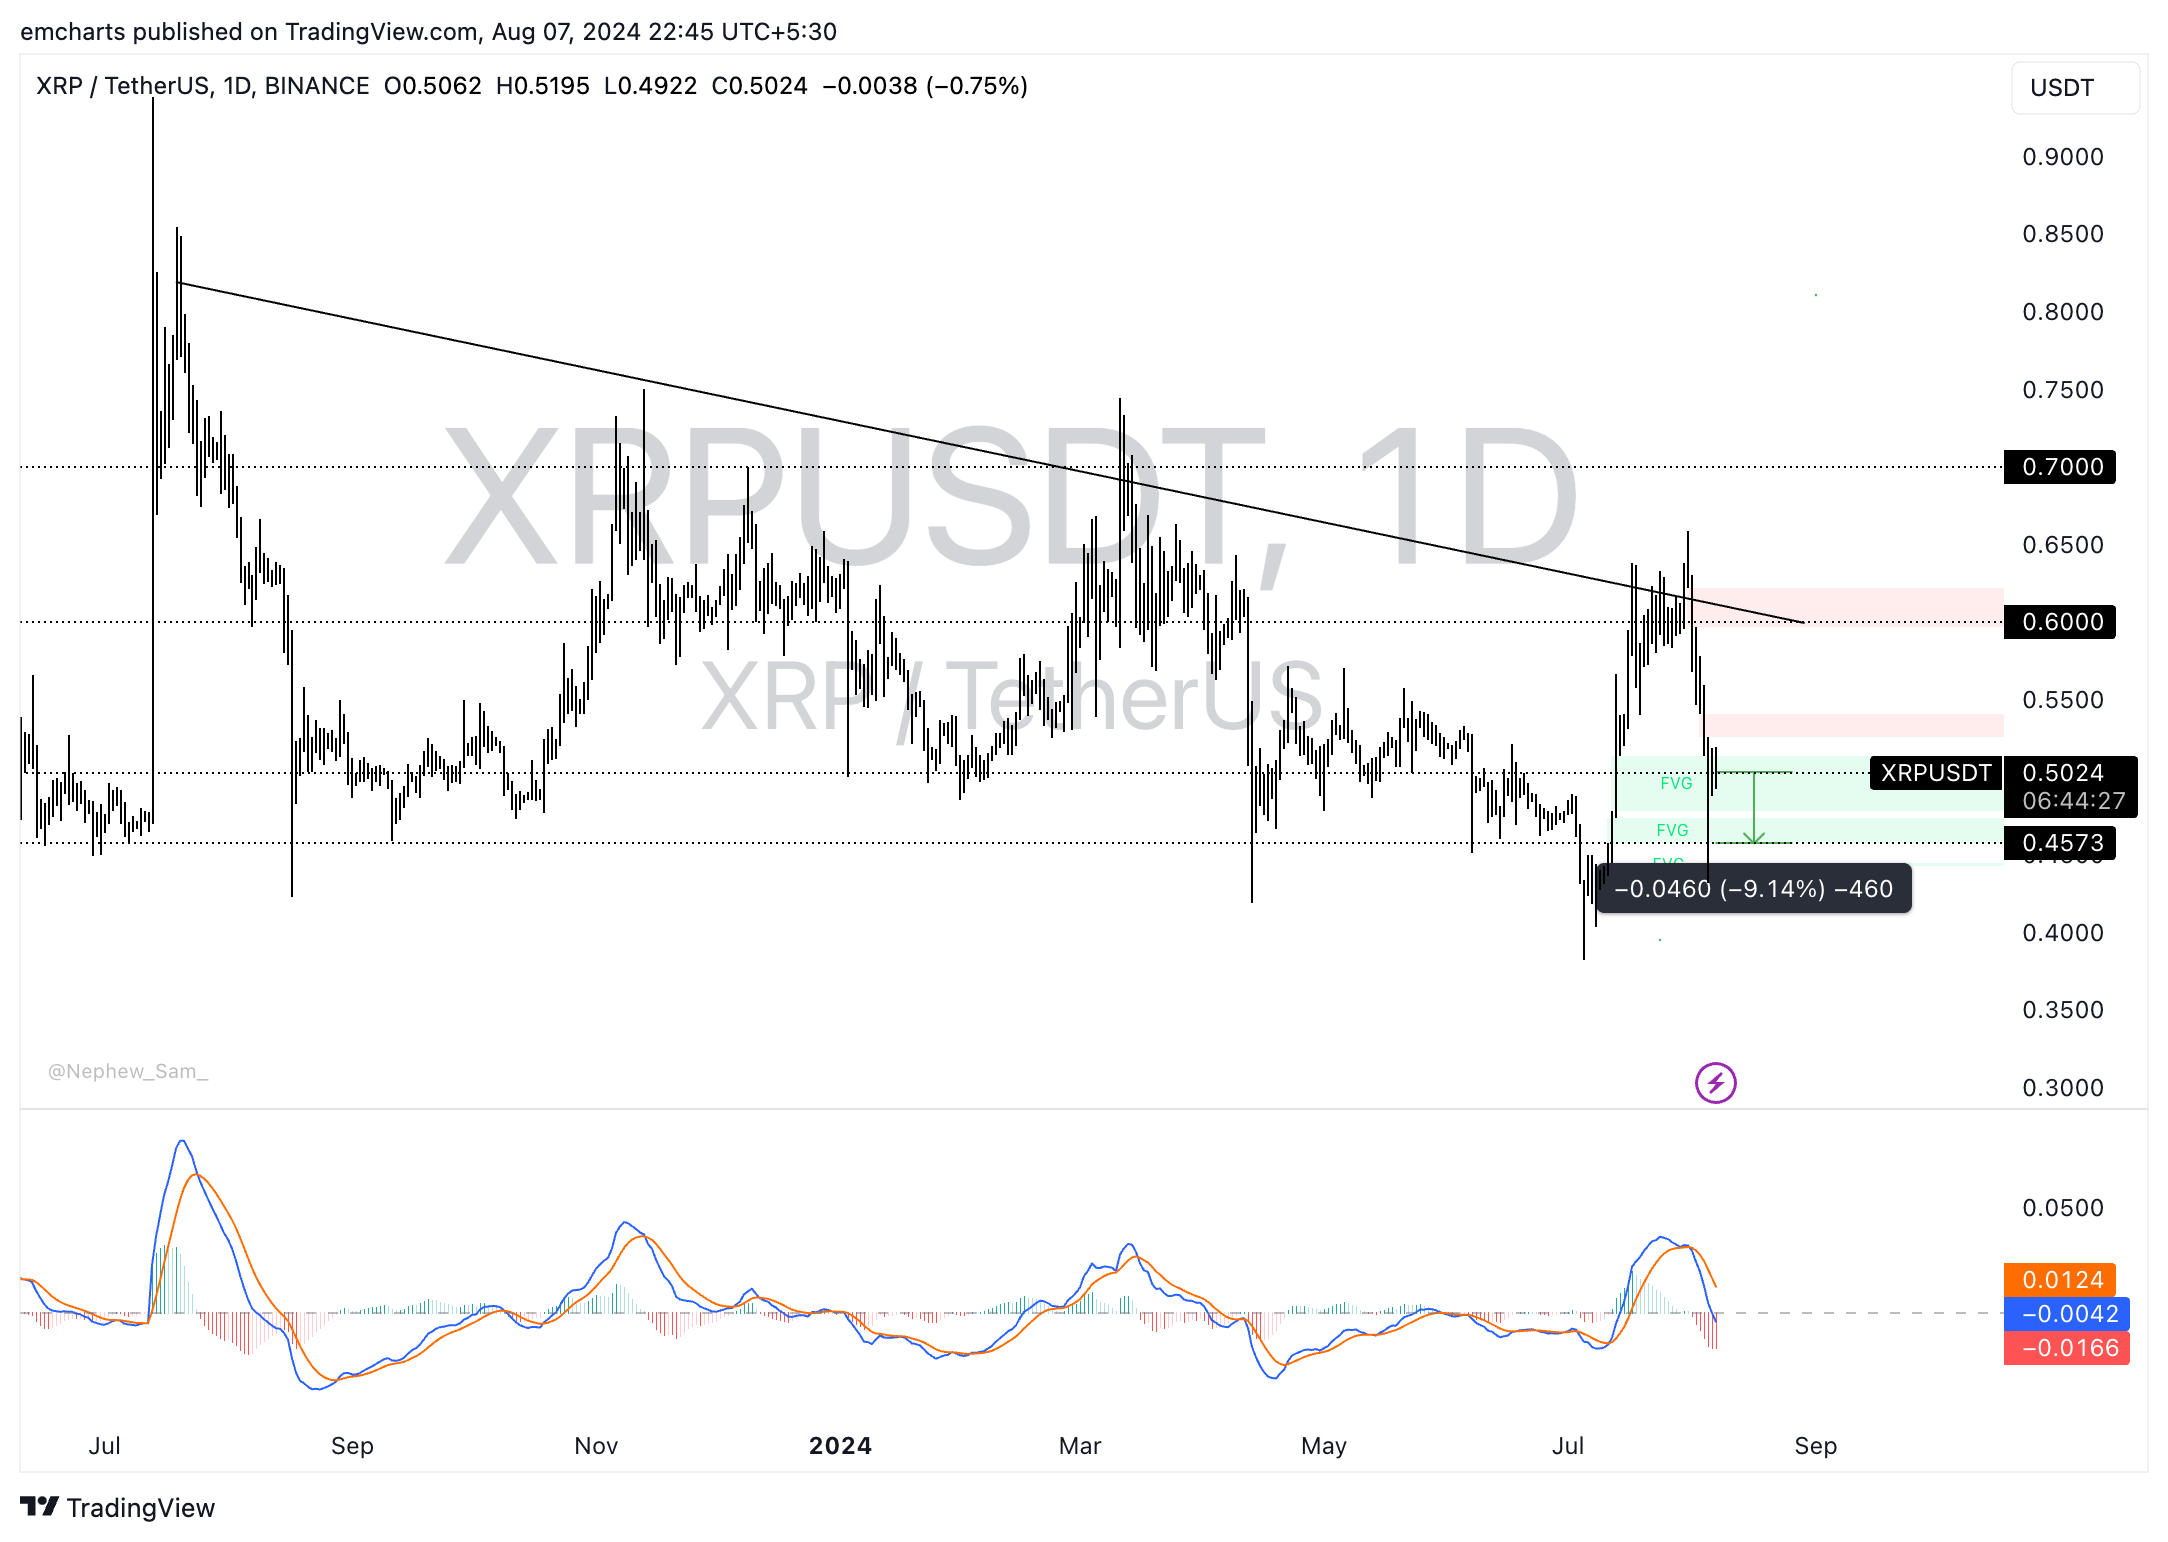
XRP/USDT daily chart
A daily candlestick close above $0.52 could invalidate the bearish thesis, and XRP could advance toward the $0.60 target.


