XRP Hammer Formation Targets Meteoric Surge Reminiscent of 110,233% Rally in 2017
 thecryptobasic.com + 1 more 08 August 2024 14:16, UTC
 XRP recently formed a hammer pattern on the weekly chart, with analyst Dark Defender citing historical data of previous formation that led to a 110K% surge.
The market analyst disclosed this in one of his recent analyses of XRP’s price movements. Notably, XRP had faced intense bearish pressure following its impressive price run toward the end of July. After spiking to a high of $0.6580 on July 31, August brought bearish pressure.
The bearish pressure was mostly due to selloffs across the broader crypto market amid geopolitical risks. XRP collapsed as the first full week of August progressed, leading to the formation of a hammer candlestick pattern. Dark Defender was the first to identify this hammer formation, emphasizing its importance in the grand scheme of things.
XRP Weekly Hammer Candlestick
For the uninitiated, a hammer candlestick is a bullish reversal pattern that forms after a downtrend. It has a small body and a long lower shadow, with little or no upper shadow. This pattern indicates that despite selling pressure, buyers are stepping in, which could signal a potential price reversal.
Dark Defender cited historical data to support this thesis. He called attention to a previous hammer candlestick formation on the weekly chart from 2017. According to him, this hammer pattern formed in March 2017, merely three weeks before XRP experienced its meteoric run.
However, The Crypto Basic could not confirm this formation on the XRP/USD weekly chart from Bitstamp. Instead, we found that this pattern actually formed in January 2017. Notably, during this time, XRP opened at $0.00674, crashed to a low of $0.00300, then recovered to close the week at $0.00640, forming the hammer.
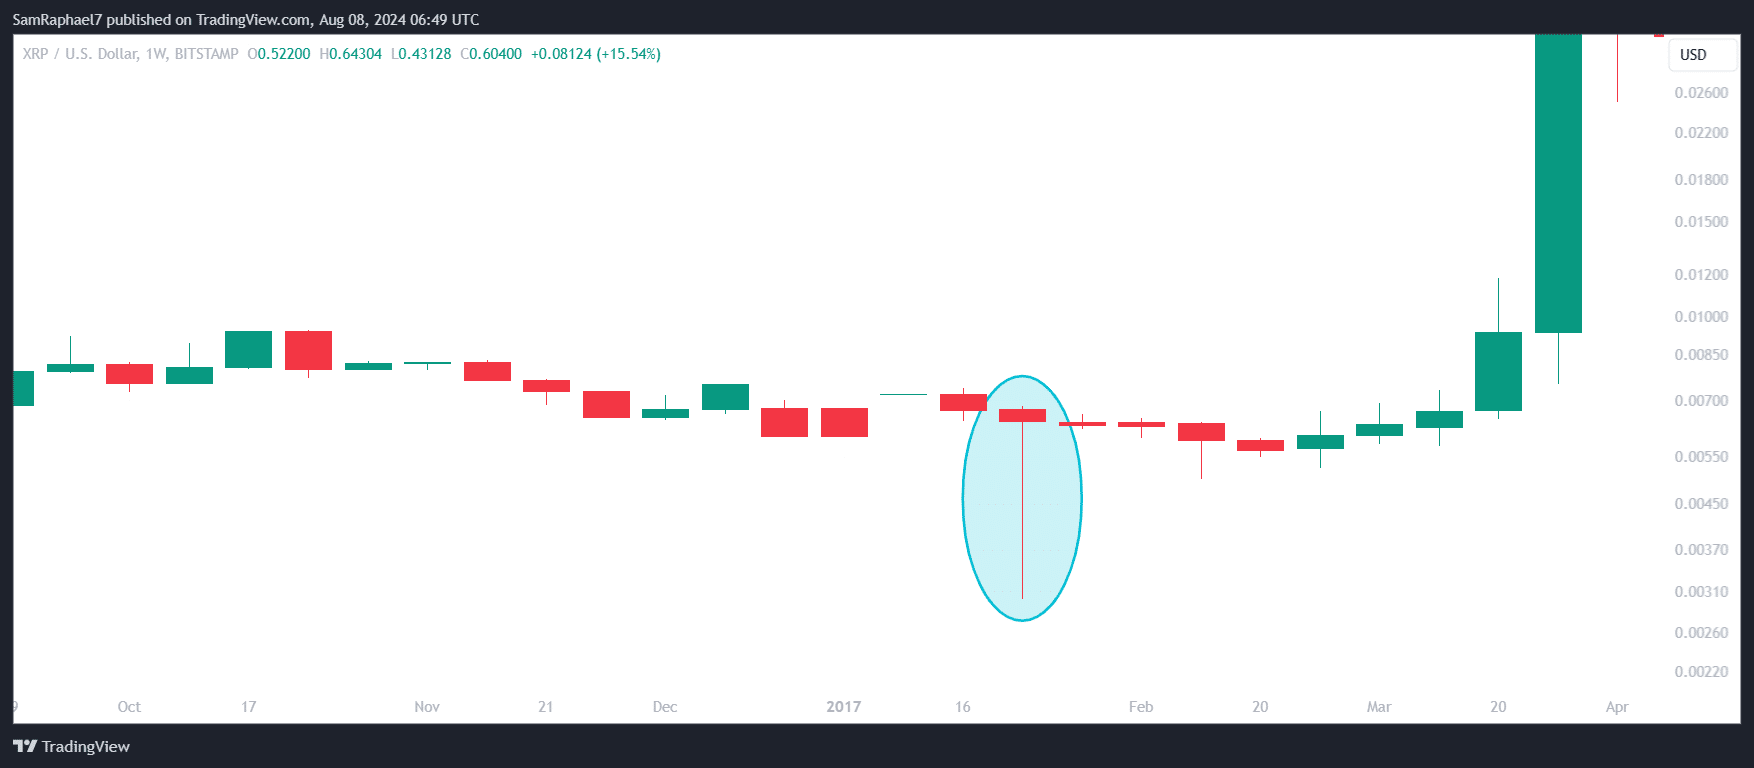
This hammer occurred amid a downtrend for XRP during the pre-bull run phase of the 2017 cycle. At the time, Bitcoin (BTC) and other assets recorded upsurges, while XRP underperformed. This is similar to the ongoing trend in this cycle.
XRP Targets Meteoric Surge
In 2017, following the hammer formation, XRP continued to drop for four more weeks before embarking in a recovery. However, this recovery push was monumental, with XRP soaring to the $3.31 all-time high in January 2018. This marked a massive 110,233% increase from the January 2017 low of $0.003 within a year.
Though not explicitly stated, Dark Defender’s analysis suggests a repetition of a similar uptrend. However, the extent of this uptrend remains speculative. In an analysis last month, the market watcher set a $5 price target for XRP amid a daily bull flag formation. However, in March, he suggested he is looking out for a $333 XRP price.
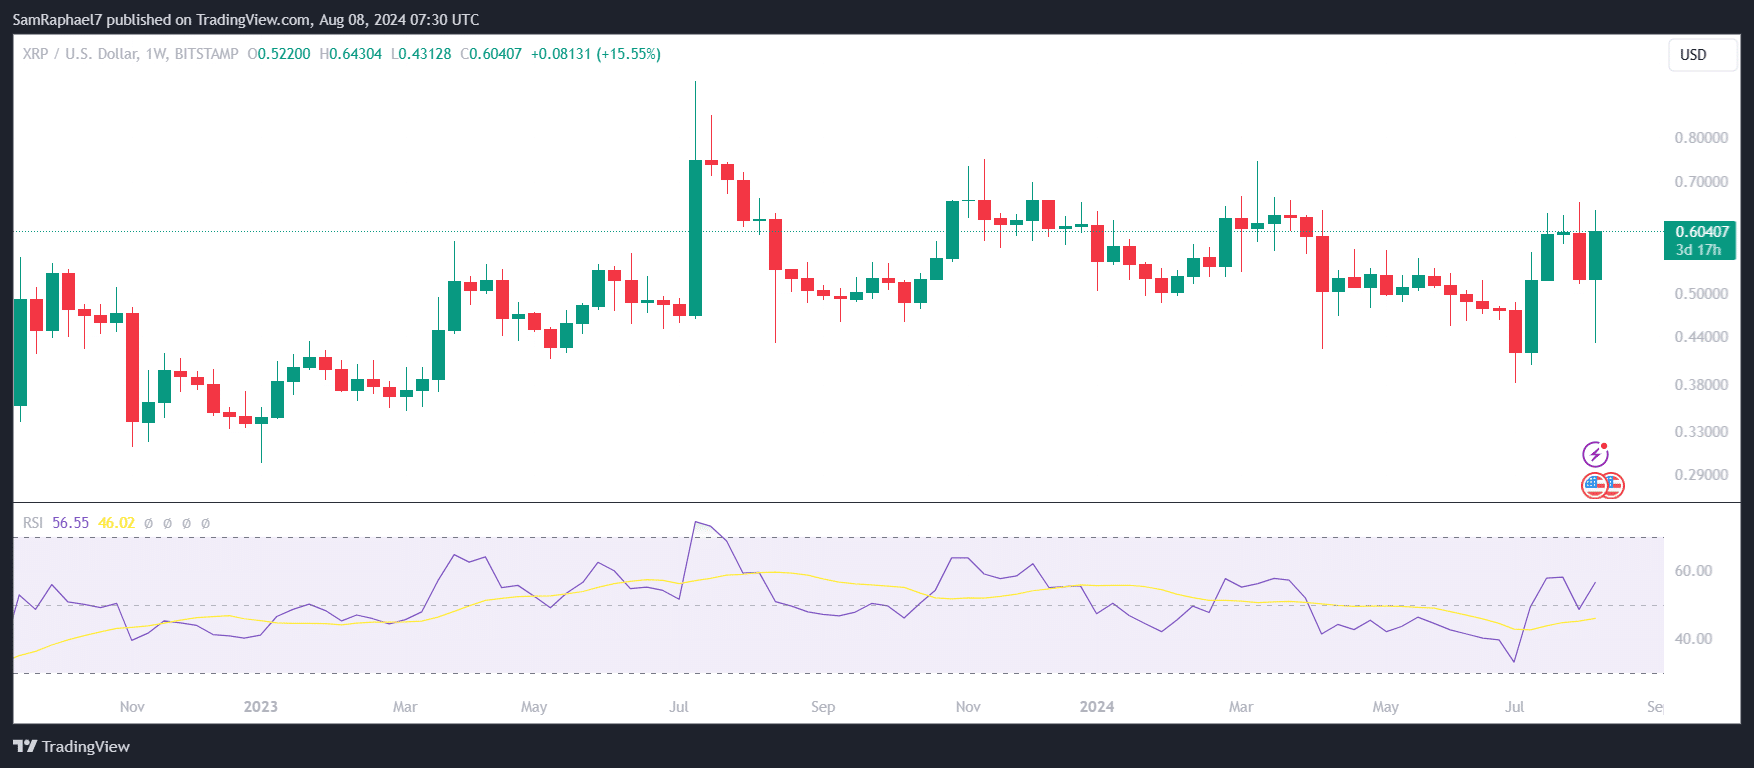
Meanwhile, recent data from XRP’s weekly chart indicates that the latest explosive surge has erased the hammer candle formation. XRP surged by more than 30% within 24 hours following the resolution of the SEC case, now up 15% this week. Currently trading for $0.6046, the asset has recovered the 13% loss of the previous week, with a recent RSI spike.