Bitcoin Price Analysis: Why Ripple's $125M Fine Could Drive BTC to $70k
 thecryptobasic.com 08 August 2024 17:27, UTC
 Bitcoin price peaked at $58,800 on Aug 8, scoring 6% gains amid bullish tailwinds from news of Ripple securing a lenient fine in the long-running lawsuit with the US SEC. Technical indicators highlight key BTC price resistance and support levels to watch.
BTC Scores 6% Gains Amid XRP Rally
On August 8, 2024, Bitcoin surged by 6%, fueled by a broader cryptocurrency market rally following Ripple’s settlement with the U.S. Securities and Exchange Commission (SEC).
Ripple Labs, led by CEO Brad Garlinghouse, agreed to pay a $125 million fine to resolve charges related to its programmed sale of XRP coins to its institutional clients.
As expected, the perceived lenient ruling has sparked optimism among investors. The settlement is seen as a significant victory for Ripple, removing a major legal overhang that had created uncertainty in the XRP/USD markets over the last 4 years.
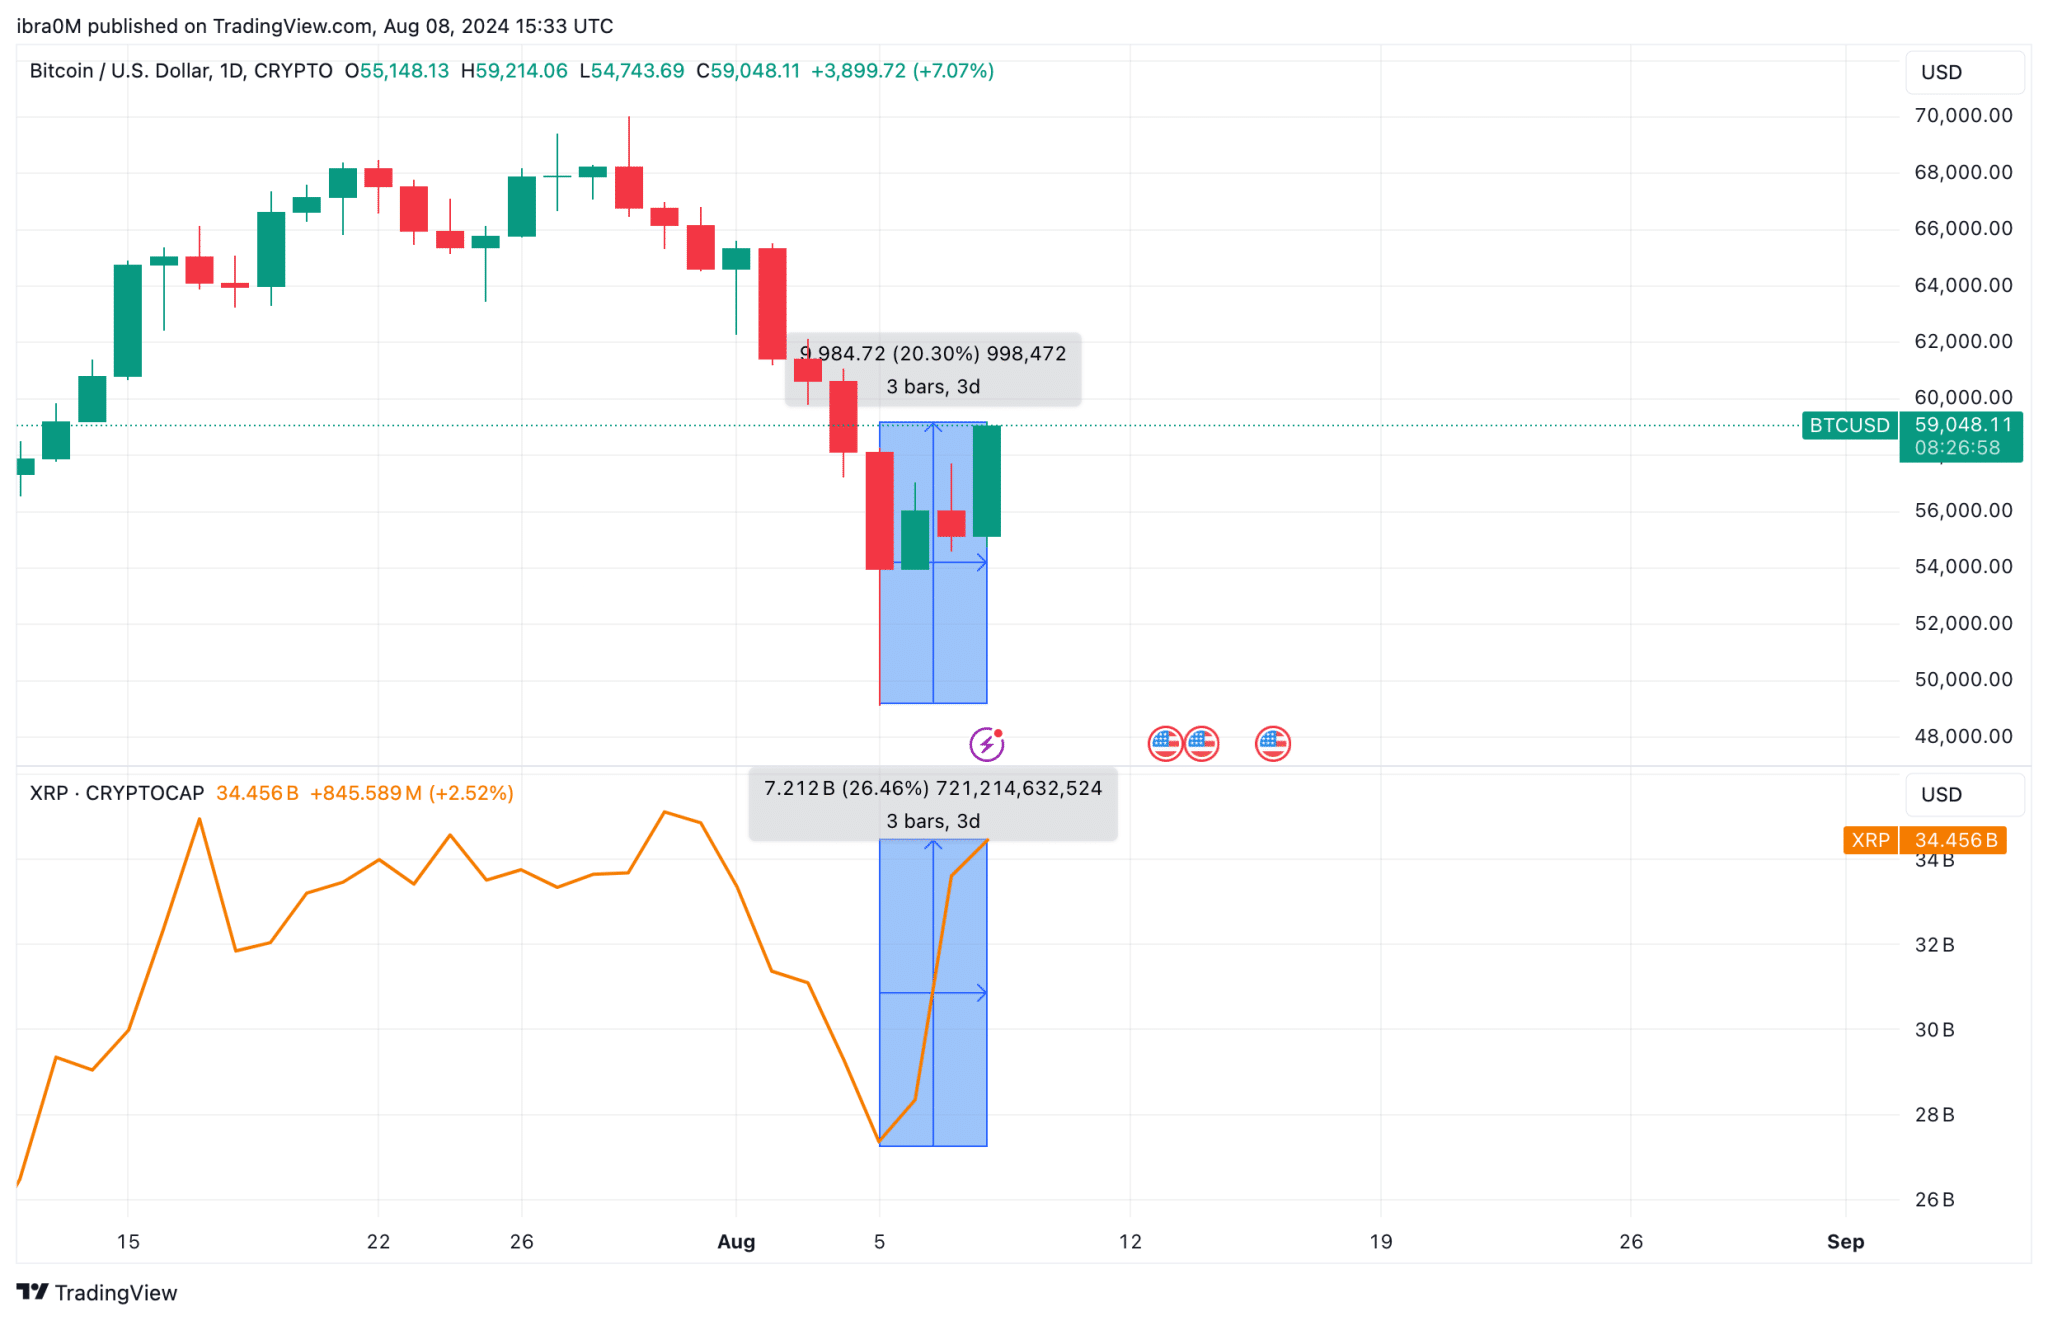
XRP led the rally with double-digit percentage gains in excess of 20%, as investors interpreted the fine as a relatively mild penalty.
This positive sentiment spilled over into the broader crypto market, lifting Bitcoin (BTC) and other assets in the top 20 crypto rankings.
Looking at the BTC/USD charts, we see how Bitcoin price grazed the $59,214 mark during the afternoon GMT trading hours. The surge in market demand propelled BTC above the $59,000 mark for the first time since the Aug 5 crash.
This confirms the narrative that Ripple settlement may have boosted investors confidence at it further deepens the regulatory clarity around cryptocurrencies in general.
BTC Price Forecast: Technical Indicators Hint at $65k Leg-Up
Notably, the 6% rally on Wednesday means that Bitcoin price has now rebounded 20% from the weekly low of $49,111 recorded during the Aug 5 market crash.
With traders still cautiously optimistic, the Relative Strength Index (RSI) and Ichimoku cloud technical indicators on the BTC/USD daily price charts are hinting at another leg-up.
First, the Ichimoku Cloud, a comprehensive indicator combining several moving averages, helps traders assess momentum, trend direction, and potential support and resistance levels.
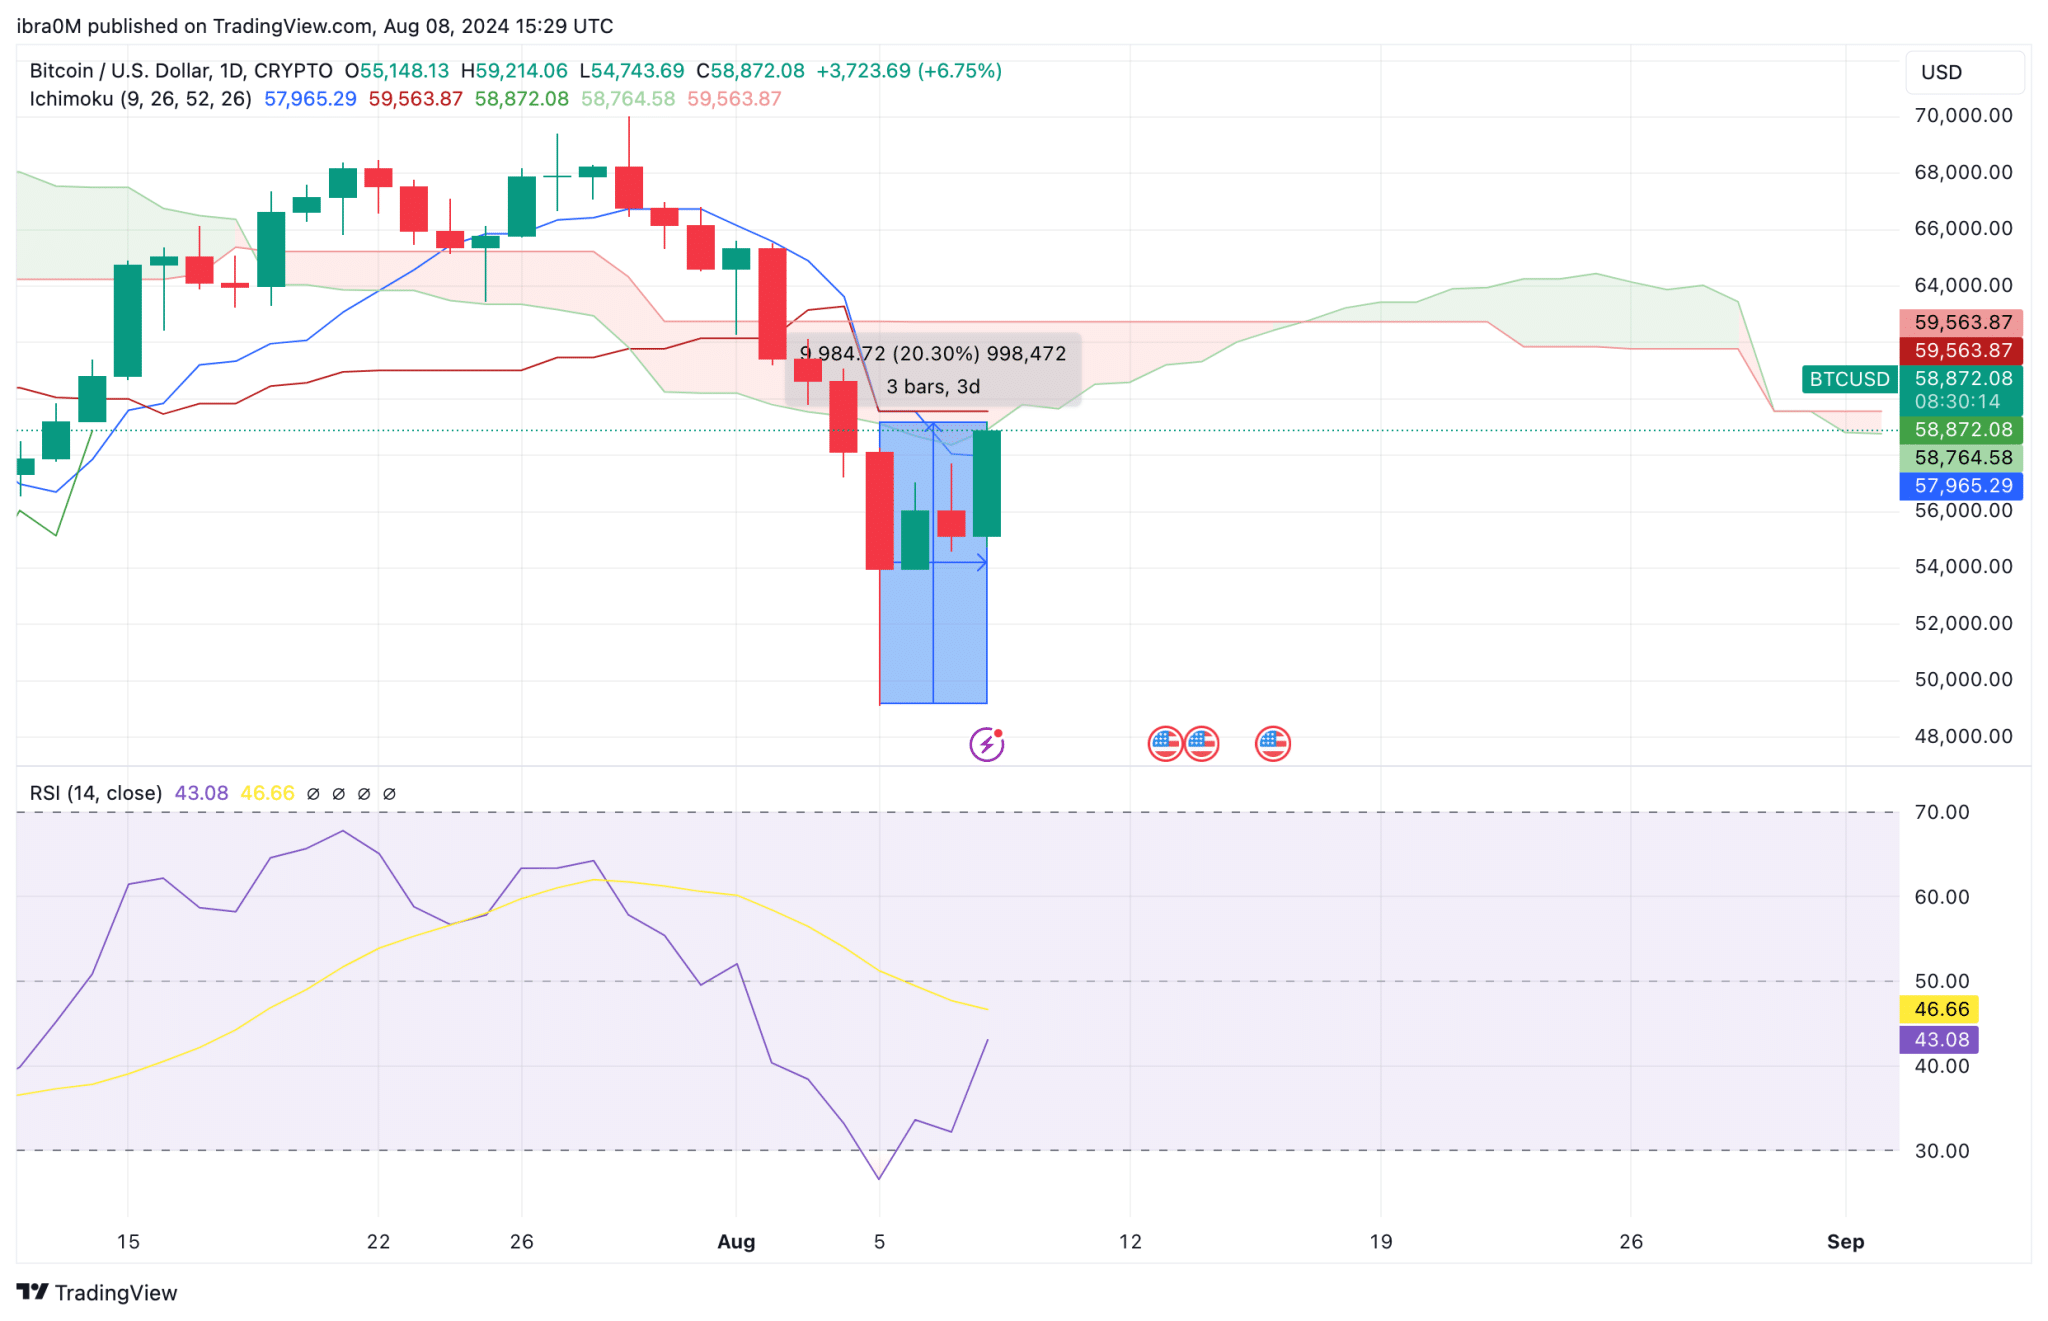
On the chart, Bitcoin is trading below the cloud, which generally indicates a bearish trend. However, today’s candle has made a significant upward movement, pushing Bitcoin towards the cloud’s lower boundary at $59,563.87.
This suggests that Bitcoin is attempting to break out of its recent downtrend, with the cloud’s lower boundary serving as the first major resistance level. A successful close above this level could signal a reversal towards the upper levels of the cloud, potentially targeting the next resistance around $60,000.
The RSI, which measures the speed and change of price movements, is currently at 43.08. This is below the neutral level of 50, indicating that Bitcoin has been in bearish territory. However, the RSI has shown a recent uptick from oversold levels, suggesting that the selling pressure might be waning.
This aligns with the Ichimoku Cloud analysis, where the price movement indicates a possible bullish reversal. If the RSI continues to rise, especially if it crosses above 50, it would further confirm a shift in momentum from bearish to bullish.


