
Polkadot (DOT) Price Showing Reversal: $5 Coming Soon?
 thecoinrepublic.com 08 August 2024 23:48, UTC
 Polkadot (DOT) saw a remarkable pullback and reverted the gains from the 52-week low mark this week. The DOT token traded in a significant downtrend and was corrected by 40% in the last two months.
The token managed the gains amid the significant recovery and noted a three-day recovery streak. Due to the prolonged decline, the DOT price has breached its major demand zone of $5. It slipped below that zone.
At press time, the Polkadot‘s DOT token traded at $4.72 with an intraday surge of 2.36%. It reflected neutrality on the charts. It has a monthly return ratio of -1.90% and 1.20% yearly, indicating long consolidation.
Polkadot’s DOT traded under the bearish influence and is capped inside a falling channel, delivering the lower low swings. Looking at the price action, the sellers continued to dominate and persist in putting pressure on the bulls.
Could Polkadot’s DOT Stretch a Recovery?
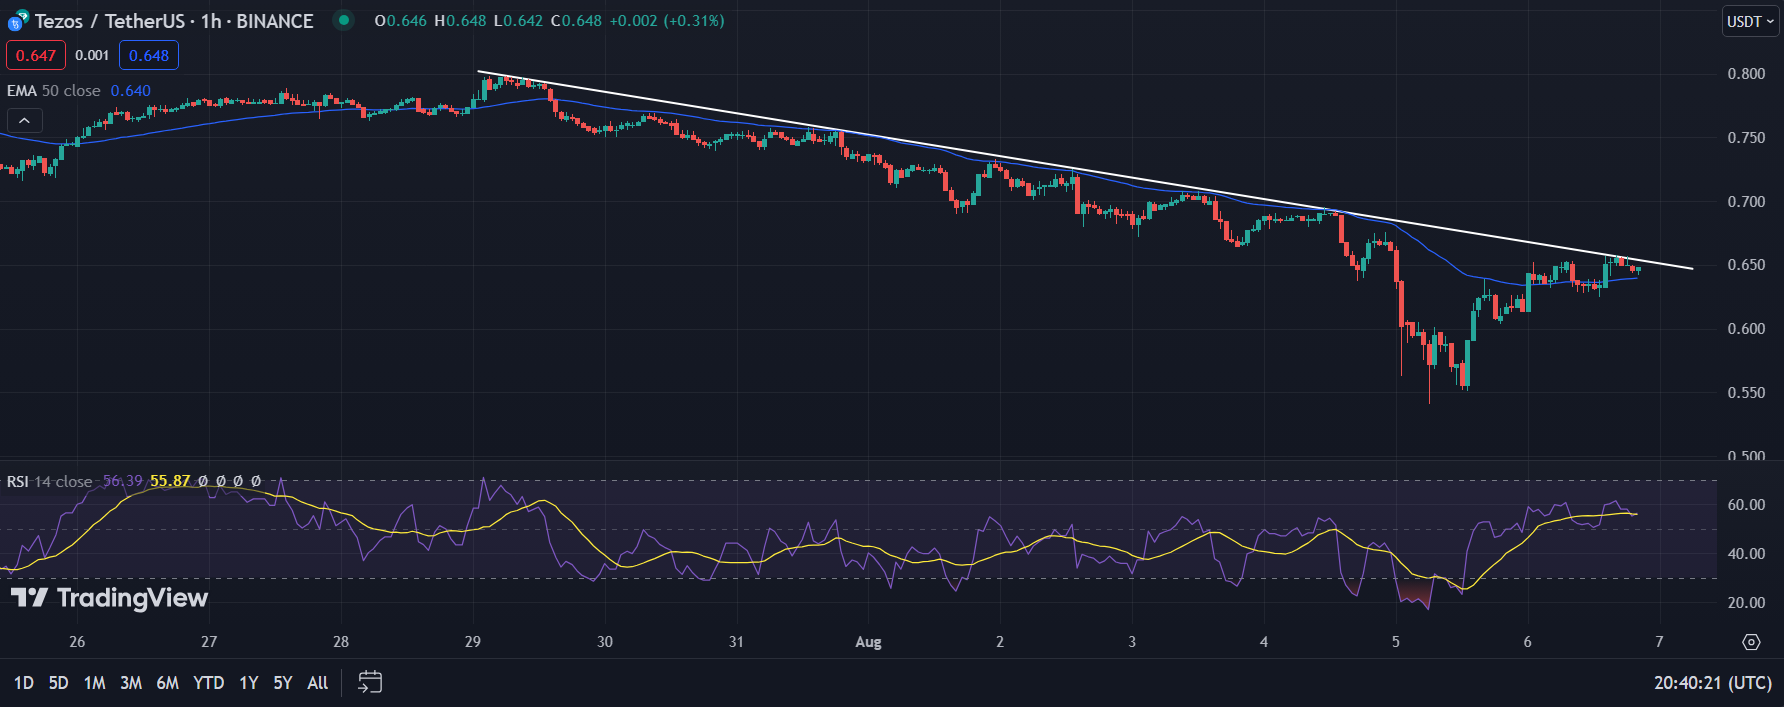
The daily chart of the Polkadot token has shown a bullish overturn from the recent correction. The bulls were eyeing to stretch the recovery toward the $5 mark. Aiming to retain the gains, a significant short-covering move was noted on the chart.
Until the token crosses the $7 mark, it may continue to drive bearish movements and be capped inside a significant range. Above the $7 mark, the token can pave the gains and trigger an upmove ahead.
The RSI curve saw a rebound from the oversold region and suggested a potential reversal might be on the horizon. It might lift the price further.
@AMCryptoAlex, in his tweet, said that DOT had made a rounding bottom formation and saw a pullback from its downward region.
$DOT reached almost 1yr low yesterday
The last time DOT was this low, it pumped 200% in 6 months
Will it happen again? pic.twitter.com/w6EebXu9Ge
— AMCrypto (@AMCryptoAlex) August 6, 2024
The correction in DOT price is due to the recent bearish market sentiments and the fear among the long traders. Still, the classic on-chain metrics highlighted a negative move and conveyed the bearish stance.
Social Metrics Saw a Downtick
Despite the price upmove, the social dominance curve saw a significant downtick. It implied a drop in online discussions and lower media buzz among investors.
Since July, the Weighted funding rate has observed a consistent negative flow, as its value has remained below the zero line. That means that the investors did not look confident in accumulating the price. Hence, a significant price correction occurred in the past sessions.
Funding Rate Witnessed a Sharp Negative Move
This week, a sharp decline in the funding rate occurred, which means a bearish sentiment. It signifies that sellers have to pay significant fees to buyers.
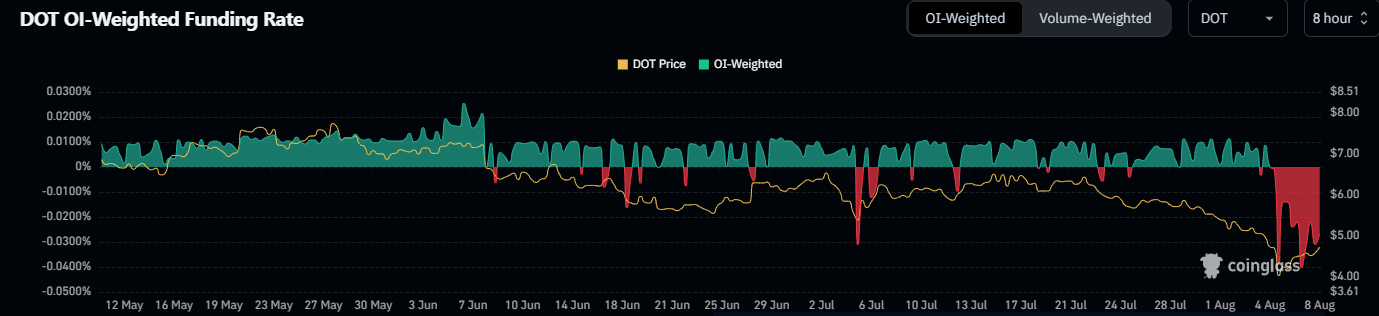
The token’s funding rate was at -0.0268% at press time, noting a severe bearish stance. It signified that the token has a lesser demand than the supply, which might impact the token’s price ahead.
Futures Open Interest Outlook
Amidst the intraday price rise, Futures Open Interest (OI) data noted flat long and short additions. It means that investors were in a dilemma, waiting for a clear directional move.
So, if the bulls maintain the bullish momentum, the token may reach $5.00 and then the $5.70 mark.
On the contrary, if the token fails to sustain gains around the $4.30 mark, it may breach the $4 mark. It can dive toward the low of the $3.20 mark ahead.
When writing, the short-term trend was weak and favored the sell-on-bounce structure. The sellers grabbed their grip around the $7 mark, and buyers continued to face rejection from that level.


