XRP on Verge of Biggest Breakout in Price History: Details
 u.today 2 h
 The price of XRP, the seventh largest cryptocurrency on the market, kicked off the new week with the green candles suddenly outshining all of its top competitors. This price action reignited talk of what could be the biggest breakout in its price history.
Thus, as some may know or notice on the chart, since 2018, after XRP ended its nearly 60,000% rally in 315 days, the price of the popular cryptocurrency started to decline, but in a specific way. As one can see, a symmetrical bullish triangle pattern has been formed following the price performance of XRP over the past six years.
This pattern is formed when the price paints lower highs and higher lows, with two converging trend lines meeting at the apex. It suggests indecision on the market with decreasing volatility as the price approaches the apex.
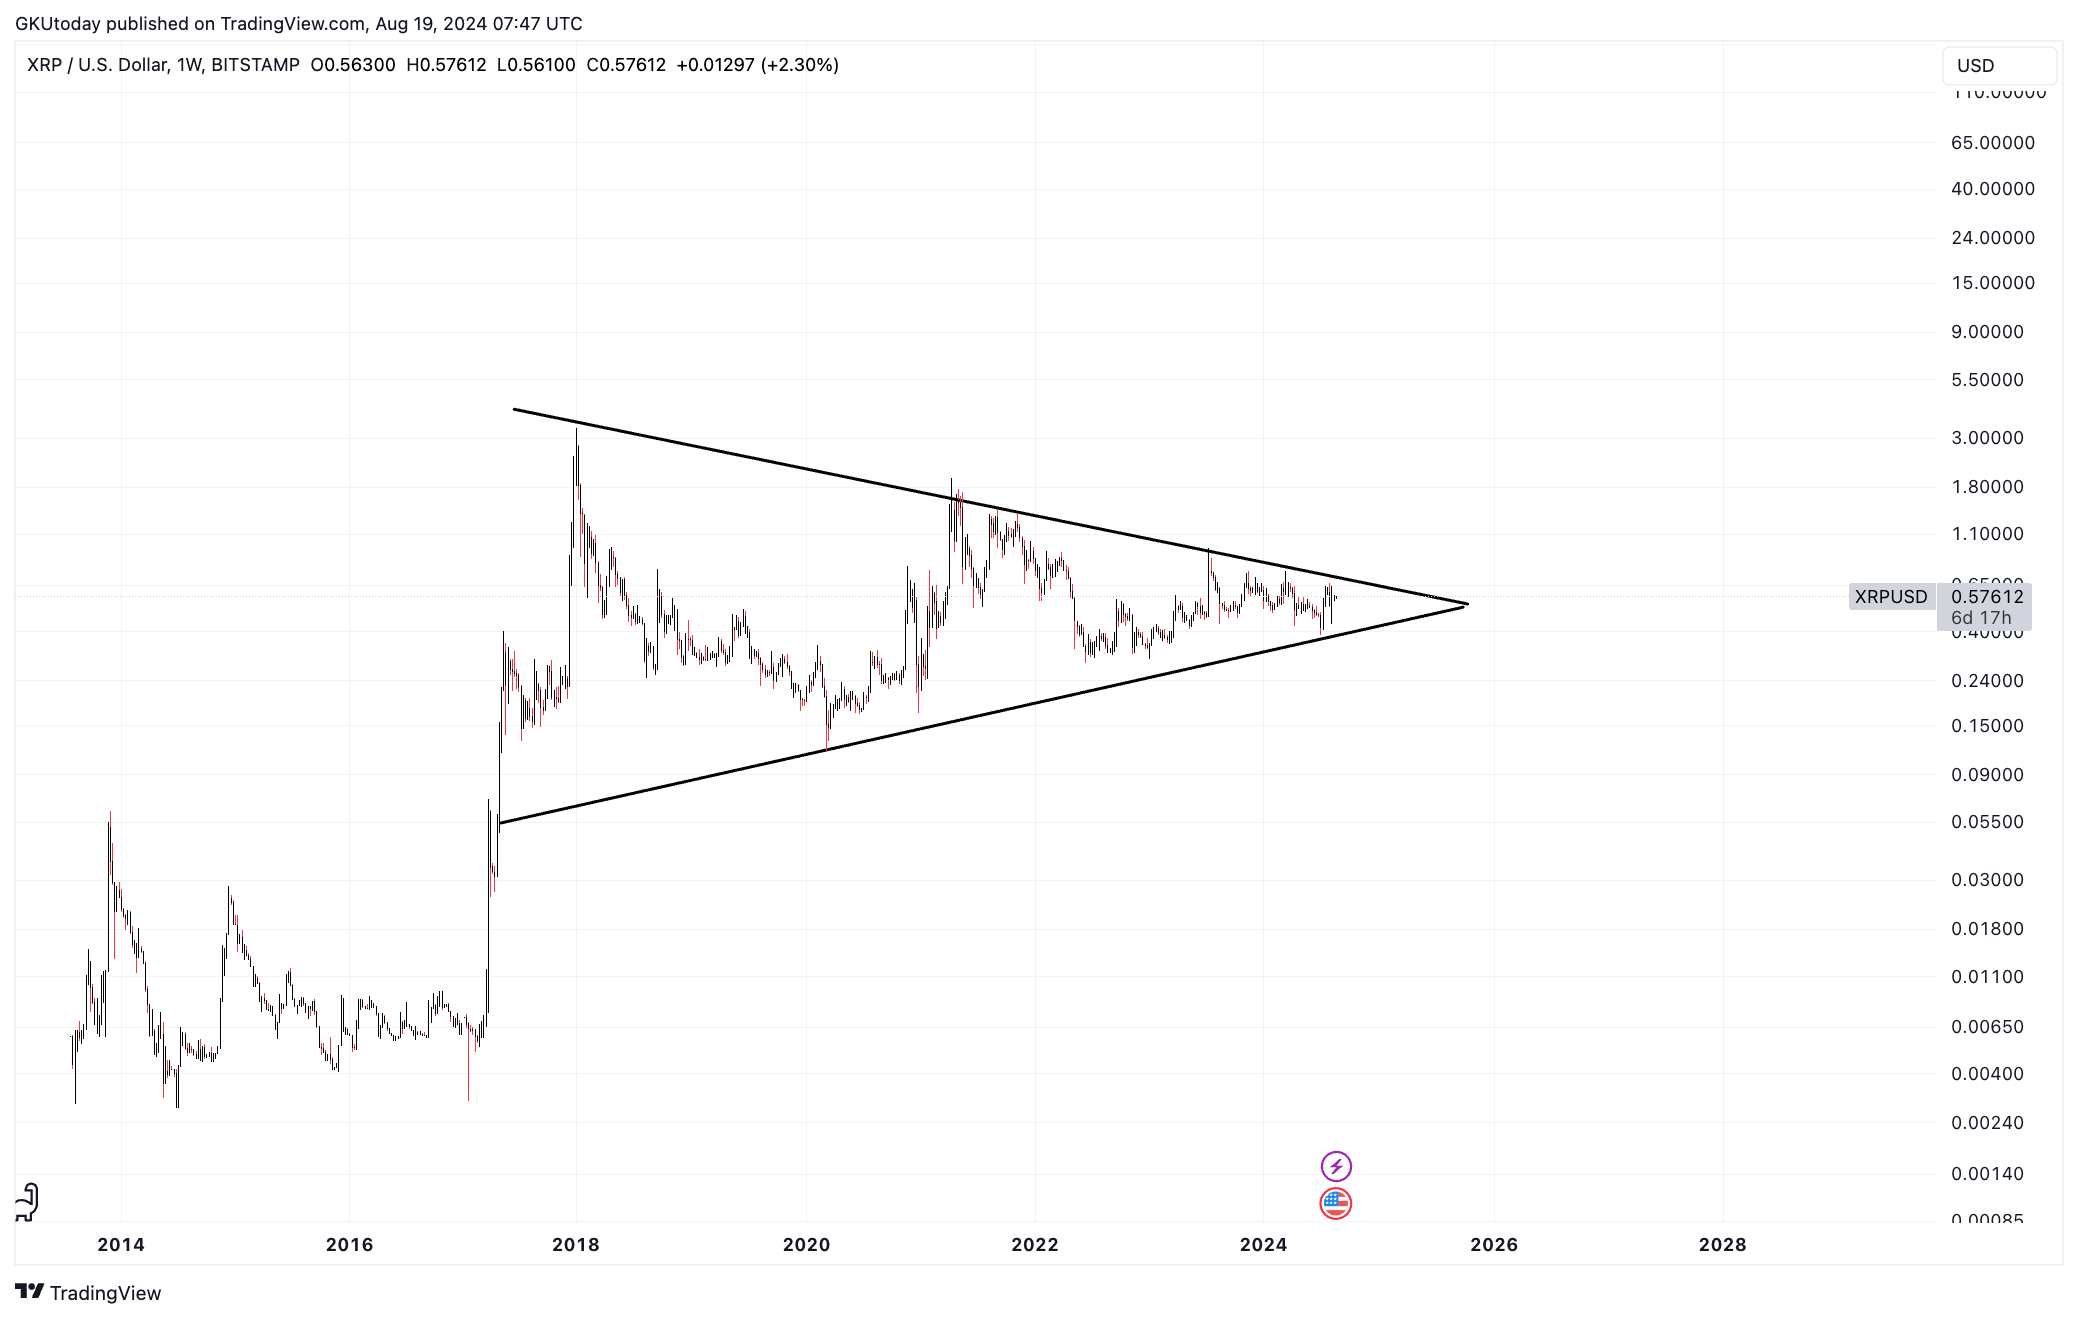
Typically, the pattern signals that the price may break out in the direction of the existing trend, which, if we are still following the 2018 case, is up. This indicates a continuation of bullish momentum for XRP once the breakout occurs.
Judging by the XRP price chart, there is not much left before the pattern is completed. However, the end has not come this year and will probably not come in the first half of 2025 either.
It is interesting to see where XRP could go if the triangle is indeed to be, as the cryptocurrency is already a $30 billion asset, and if it achieves even half of 2018’s performance, it will be 30,000%. That means XRP’s market cap could reach $9.66 trillion – something you probably did not believe could happen.


