
DEXE Eyes $12 as Large Transactions Shoot up by 5.57%
 thecryptobasic.com 2 h
 With a bullish reversal for DEXE in a falling channel, the shift in the underlying momentum teases a breakout run. Will the buyers surpass the high supply trendline for a run to $12?
As Bitcoin hangs at $58,500 and Ethereum at $2,620, altcoins are starting to give early signs of recovery. Despite $50 million worth of long liquidations, some altcoins are starting the week on a slightly bullish note.
In a union of Meme and DeFi, DEXE is among the top performers today, with an intraday gain of 1.44%. Further, the 24-hour rise accounts for 7.98% and completes a four-day streak of bullish candles. Will this uprising boost DEXE to $12?
DEXE Shoots up with a Double Bottom
The DEXE token shows a declining trend in the daily chart, resulting in lower highs and lower lows. Furthermore, the price action forms two parallel trendlines, keeping the DEXE price in a bearish channel.
The bearish downfall accounts for a 50% drop since June 2024, starting from $14 to the bottom baseline of $7. However, the bullish dominance at the psychological mark of $7 results in a double-bottom pattern.
The neckline of the bullish reversal pattern stands at $7.80. On August 17, DEXE initiated this bullish reversal with the recent morning star pattern. Further, it accounts for a 13% jump in four days.
Coming to the technical indicators, the daily RSI line indicates a bullish divergence amid the previous two declines. This increases the possibility of a bullish breakout rally. However, the declining 15-day SMA warns of a death cross with the 200-day SMA. Meanwhile, the pre-existing bearish crossover of the 100-day and 200-day SMA keeps a bearish tone over the daily chart.
Growing Transactions Tease a Bull Run in DEXE
According to recent data from Intotheblock, large transactions have increased by over 5%. In addition, DEXE holders making money at the current price account for 62% of all holders, with 77% of holders holding the token for over a year.
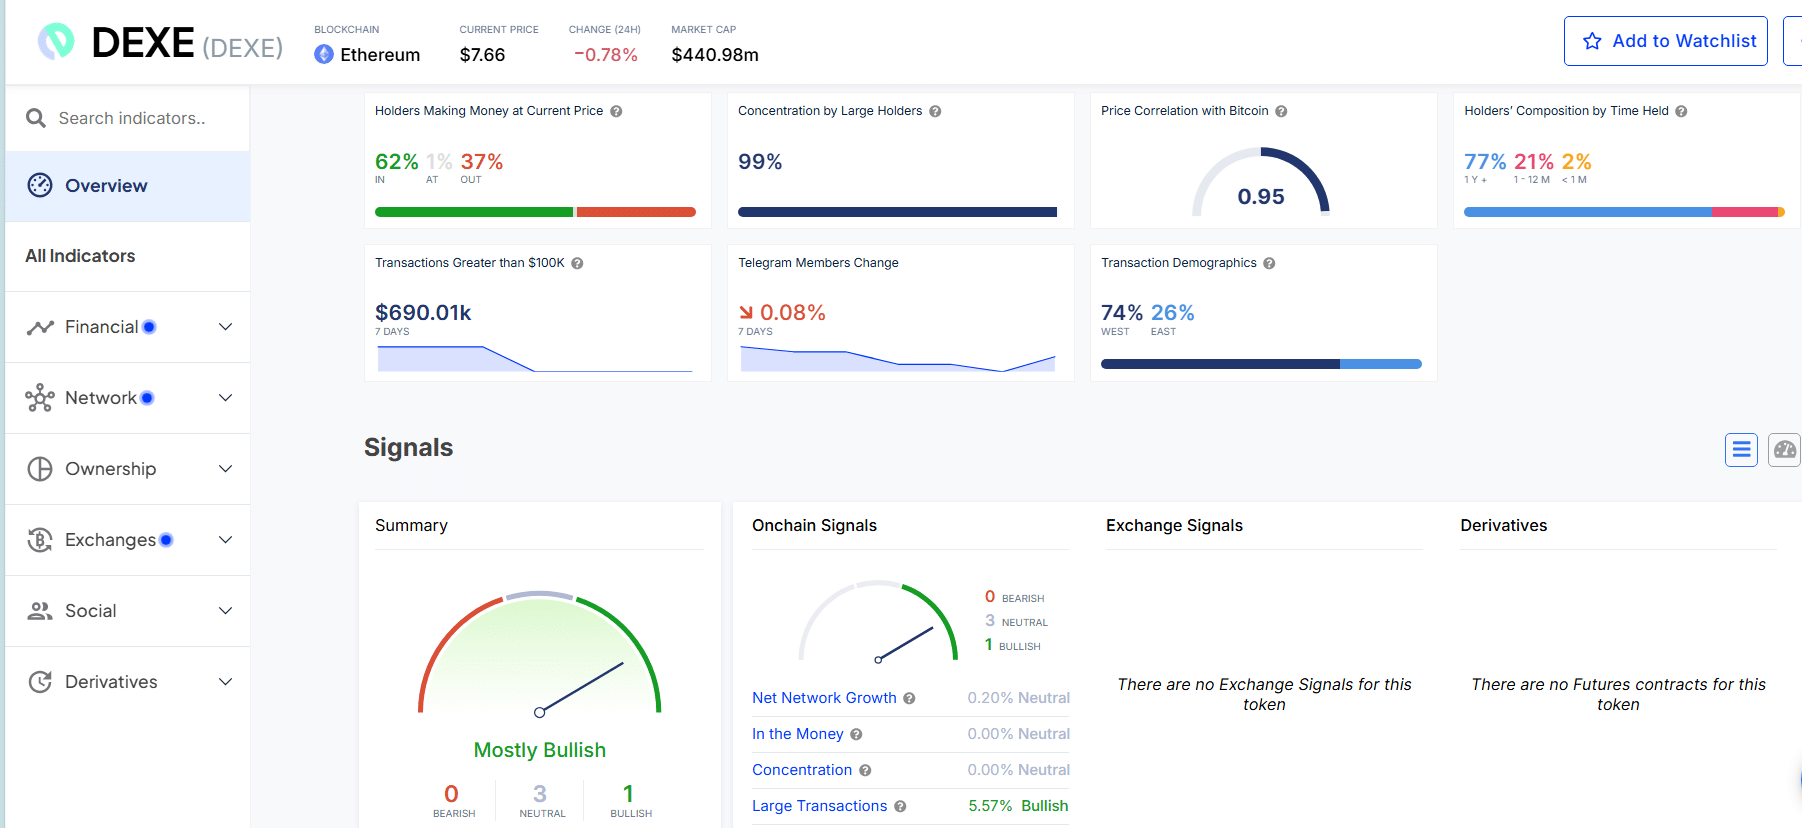
However, 99% of the circulating supply is concentrated by large holders, which is a ticking time bomb considering the chances of a pump-and-dump scenario.
Will DEXE Hit $12?
Currently, the intraday growth of 1.47% as DEXE trades at $7.86 tests the double-bottom neckline. A bullish breakout of the double-bottom pattern will put the overhead resistance red line at risk, signaling a potential bullish breakout.
The breakout rally will face the next resistance levels at $8.60, $10.80, and $12.86. In case of a bearish reversal from the overhead trendline, the next support levels are at $6.96 and $6.00.


