
Persistent Bearish Pressure Puts Polygon (MATIC) at 19% Downside Risk: Details
 thecryptobasic.com 29 August 2024 10:33, UTC
 Will the streak of bearish candles continue as the downside risk in Polygon (MATIC) rises to 19%?
Amid the broader market crash, Polygon failed to uphold the recent 44% price jump registered over the past week. As the Polygon price records a 22% fall in four days, the bearish trend continues to gain momentum.
Will Polygon survive the bearish trend for a bounce back?
Retest Phase for Polygon
Currently, the Polygon trades at $0.4325 with an intraday drop of 3%, forming the fifth consecutive bearish candle. In the daily chart, the bull run last week led to a breakout of the 50-day long-coming falling channel pattern.
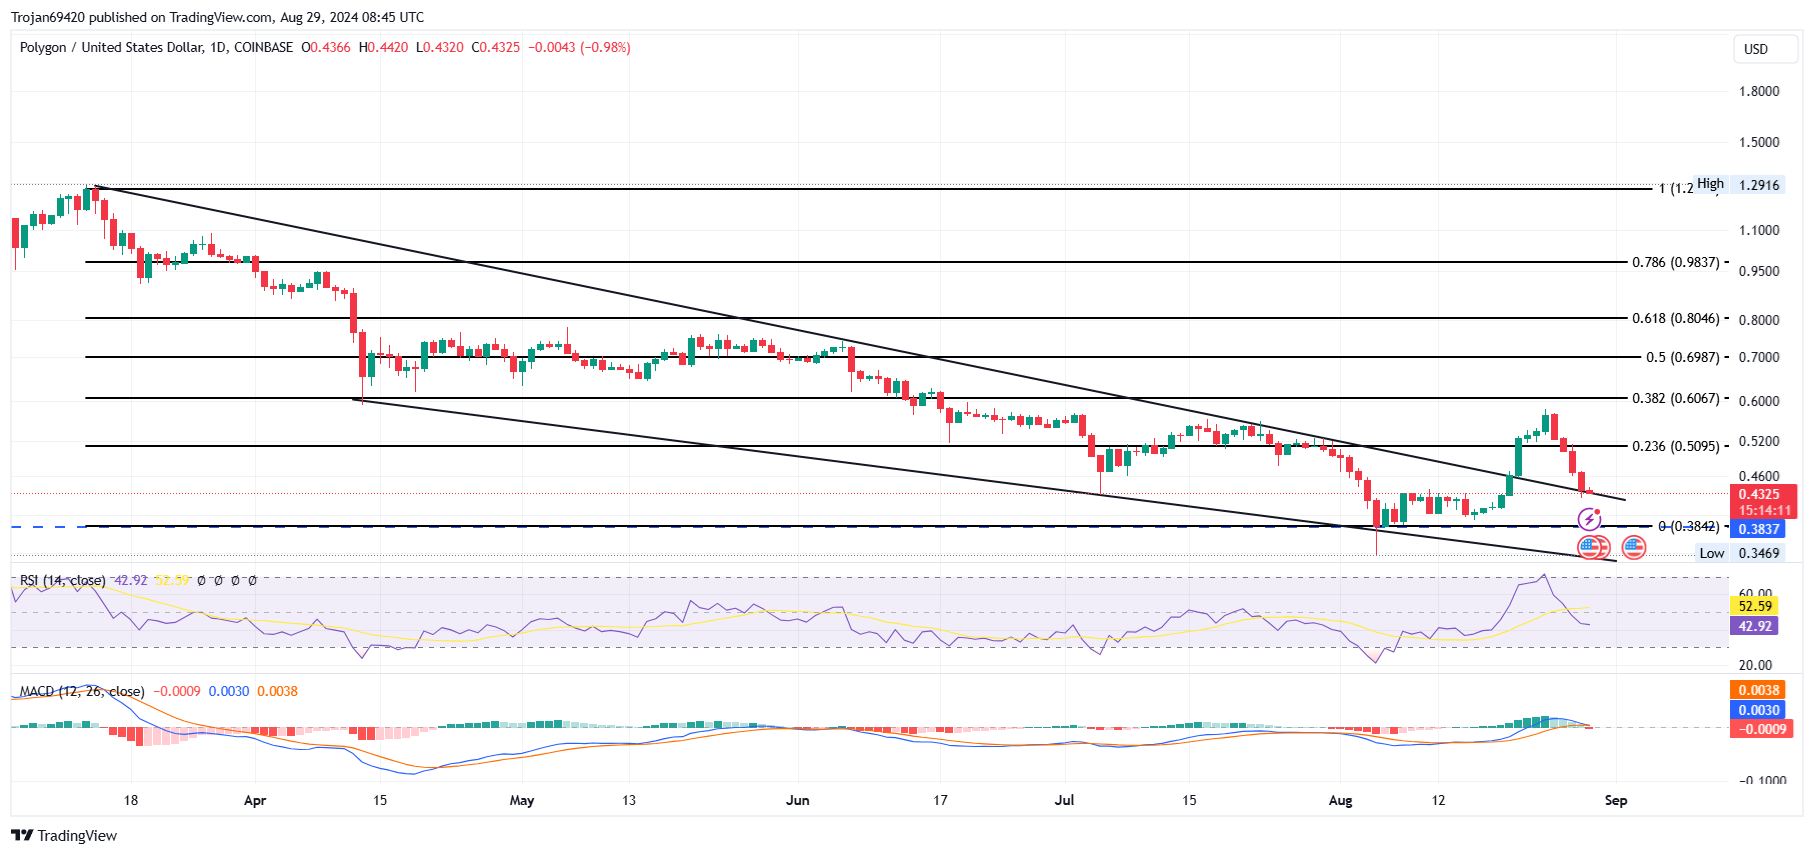
However, the bull run failed to surpass $0.60, resulting in a quick decline to the broken resistance trend line. As a retest, the high momentum teases a bearish continuation.
The daily RSI line shows a quick decline from the overbought zone to crashing under the 50% halfway line. The MACD indicator shows a quick reversal in the MACD and signal lines, leading to a bearish crossover. Hence, with a quick shift in the underlying sentiments, the Polygon price warns of a bearish continuation.
Signs of Recovery in Polygon Network
Amid the correction phase of MATIC, Santiment highlights the Polygon network’s declining trend since the broader market pullback starting in March. However, signs of recovery are emerging with increased dominant coin movement and a spike in active addresses on the Polygon network.
Notably, active addresses reached their second-highest level in 2024, with 3,369 MATIC addresses, and there was significant movement involving 69 billion MATIC tokens.
Where is Polygon Headed?
Based on Fibonacci levels within the falling channel pattern, the bearish trend in Polygon’s price has failed to reach the 38.20% Fibonacci level near $0.60 and has broken below the 23.60% level at $0.50.
The next support levels for the altcoin are at $0.40, with a baseline at $0.38 and a further downside risk to $0.3649, representing a 19% decline. In the event of a post-retest reversal and broader market recovery, the next resistance levels are at the 23.60% Fibonacci level at $0.50 and the 38.20% level at $0.60.


