
Shiba Inu Eyes $0.000015 With Short-Term Triangle Breakout
 thecryptobasic.com 29 August 2024 10:35, UTC
 Amid a bearish patch for meme coins and altcoins, Shiba Inu prepares for a price jump against the broader market sentiment.
With a breakout run in the shorter timeframes, the meme coin prepares for a bullish domino effect. Will the minor push in recovery result in a price jump to levels above $0.000015 for Shiba Inu?
Recovery Run Begins For Shiba Inu
Shiba Inu shows early signs of a recovery run, with a 2.09% intraday growth. Currently, the meme coin is trading at $0.00001415, and a bullish candle is in the making.
The bullish candle after a Doji candle formed yesterday with a 0.73% growth follows the 5.82% crash on Tuesday. With this bullish recovery, a Morning Star pattern is forming over the daily chart. The meme coin has increased by 2.48% in the last 24 hours.
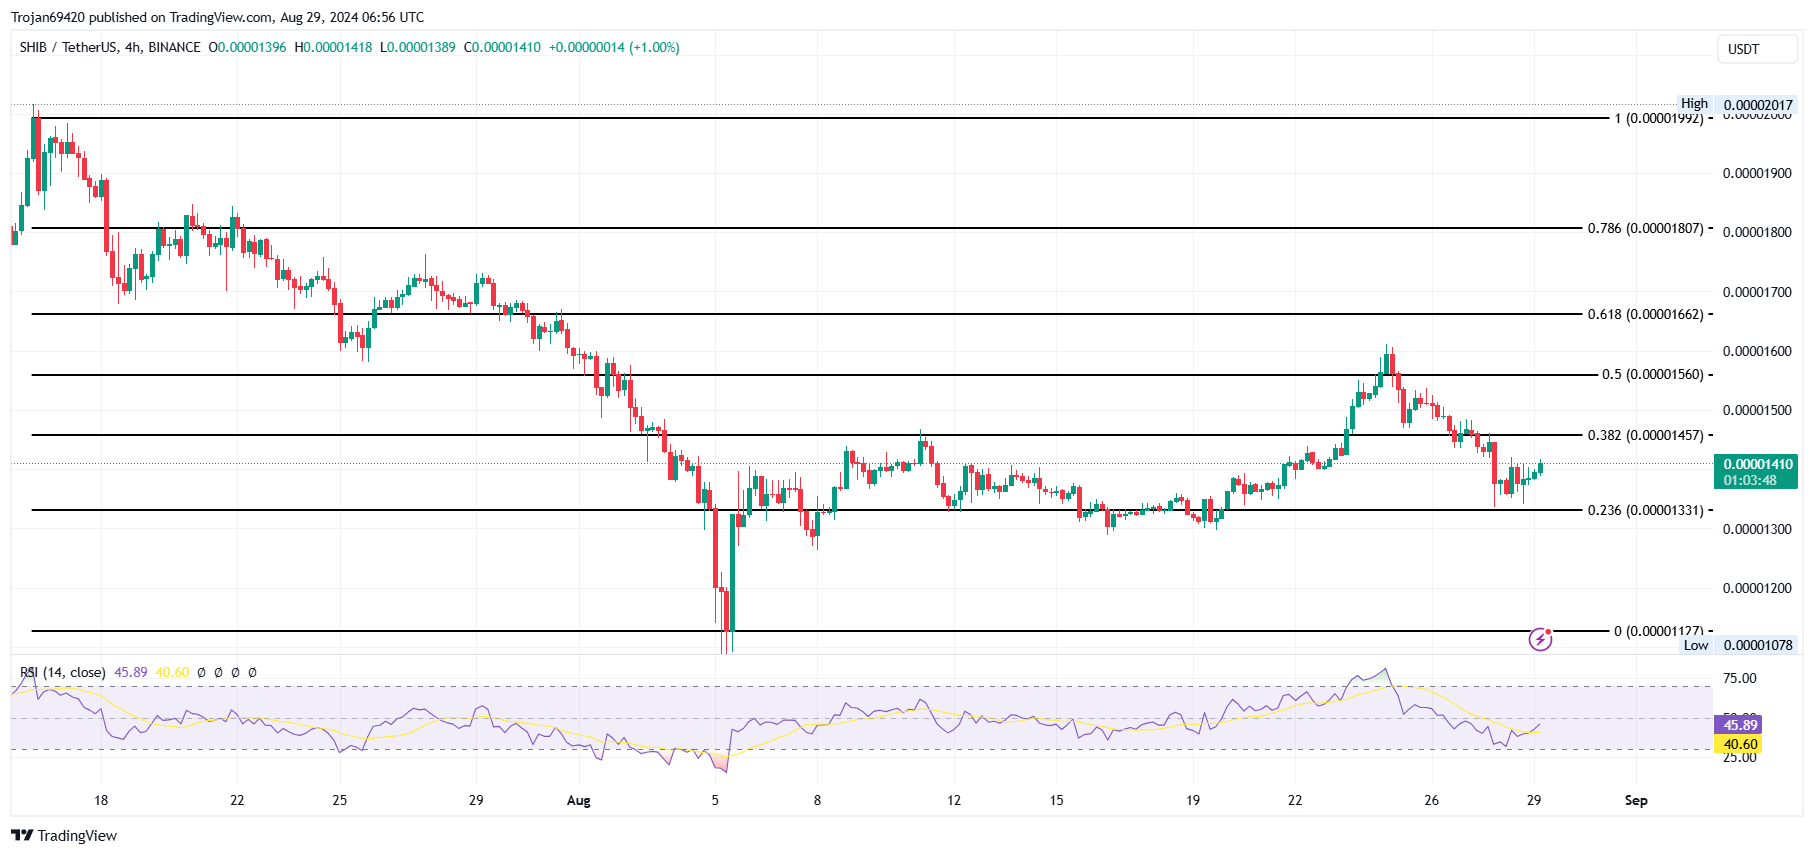
The bullish recovery comes as a potential bull cycle within a larger falling wedge pattern in the daily chart. However, in the 4-hour chart, the bullish recovery in Shiba Inu comes after taking support at the 23.60% Fibonacci level, based at $0.00001331.
With a streak of four bullish candles, the meme coin has increased by 5.52% over the last 12 hours. This marks a bullish reversal in action, ready to challenge the 38.20% Fibonacci level at $0.00001457.
Triangle Breakout Run in 1-Hour Chart
A closer analysis revealed that the 1-hour time frame reveals a bullish breakout of a long-coming resistance trendline and a triangle pattern. The bullish reversal forms a support trend line as well, and the breakout rally continues to gain momentum.
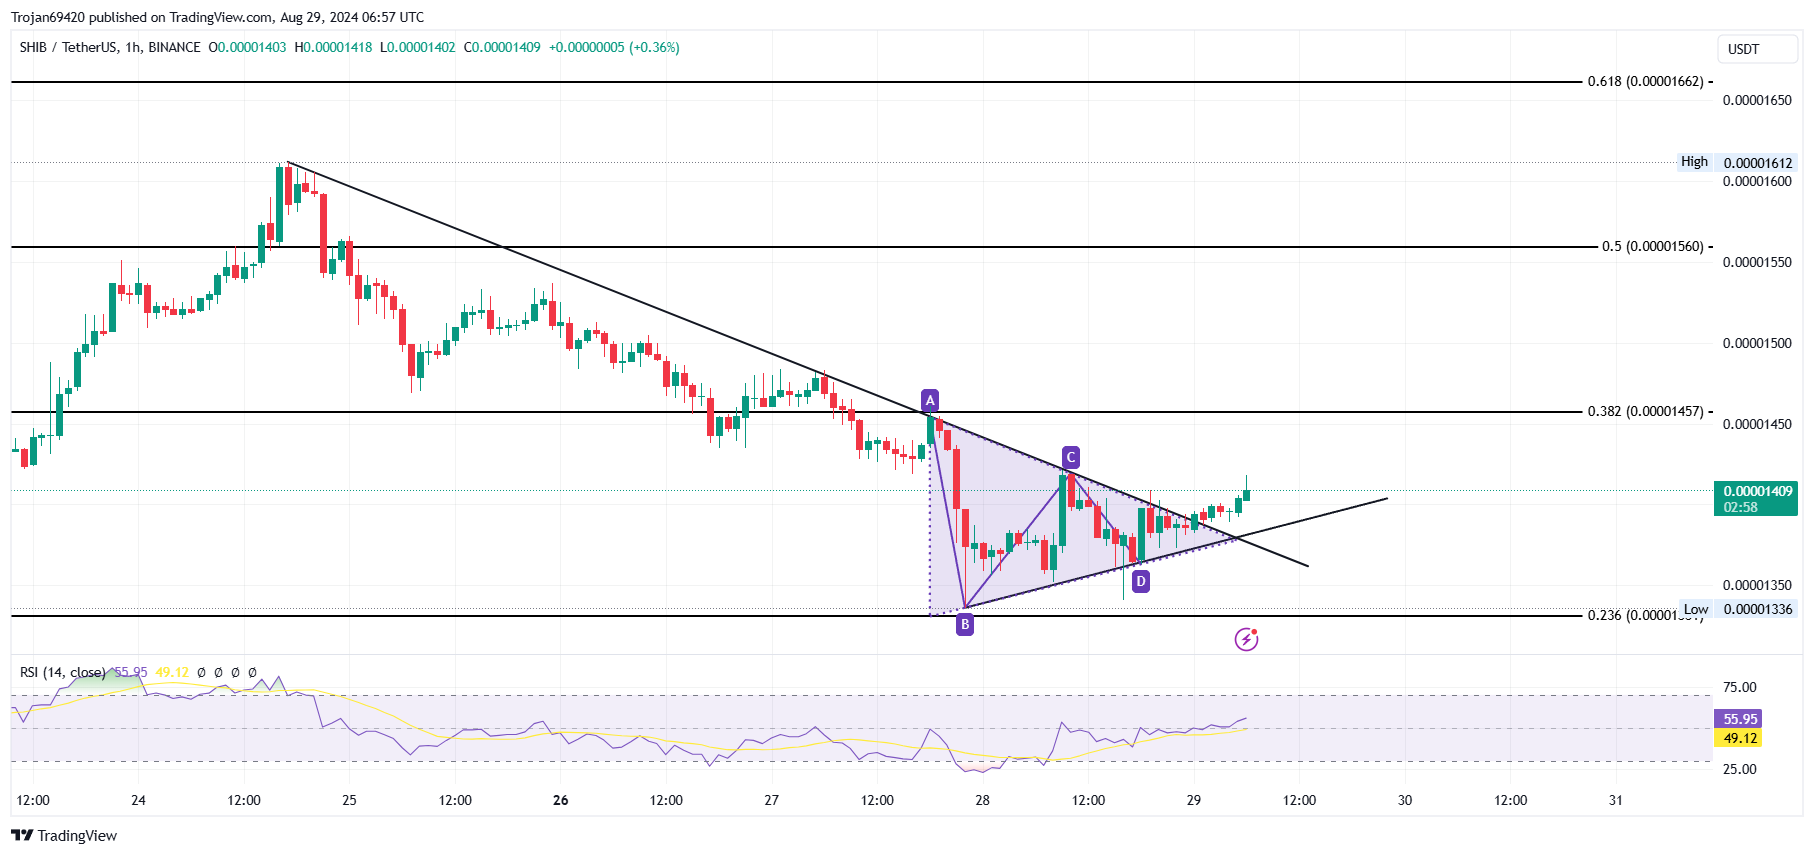
The RSI line in the 4-hour and 1-hour price charts confirms a bullish trend surpassing the halfway line. Further, the uptrend begins with a successful bullish divergence.
As the recovery run gains momentum, the upside resistances based on the Fibonacci level, apart from the 38.20% level, are at 50% and 61.8%, corresponding to the price thresholds of $0.00001560 and $0.00001662, respectively.
On the downside, the support levels are present at the 23.60% level, in brackets $0.00001331 and $0.00001127.


