HBAR Price Gains Momentum: Is a Trend Shift Coming?
 cryptonewsz.com 30 August 2024 01:40, UTC
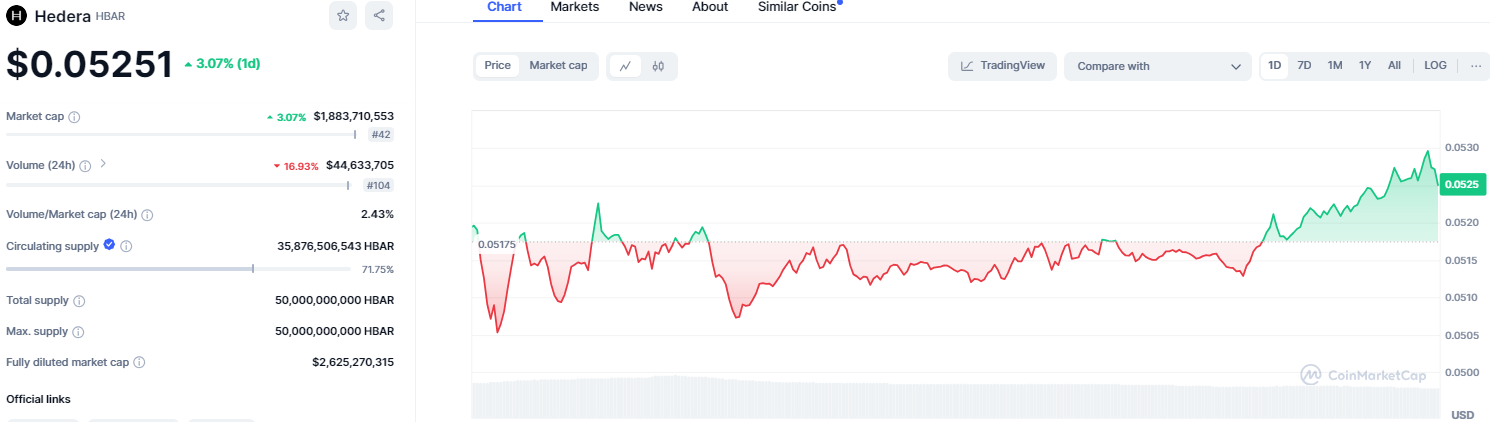
 Following today’s crypto market rebound, the Hedera Hashgraph (HBAR) has shown signs of recovery, with its price increasing from an intraday low of $0.05049. As of press time, the HBAR token exchanged hands at $0.05272, marking a 1.86% uptick in a single day.
Despite these gains, the asset has been on a long-term bearish trend and has yet to recover from the recent market downturn fully. As observed on the monthly and weekly charts, HBAR reflects a 21.20% dip and a 3.82% decline, respectively.
However, a breach above the $0.0658 level could eliminate the negative sentiment in the asset market, signalling a trend reversal.
HBAR’s Market Cap Dips to Deeper Levels in Mid Q3
According to a Messari report, HBAR’s circulating market cap declined by 29% QoQ in Q2, dropping to $2.7 billion after three consecutive quarters of growth. Despite this decrease, HBAR’s market cap ranking among all tokens improved by six spots, moving from 36th to 30th, surpassing other crypto assets in a similar price range.
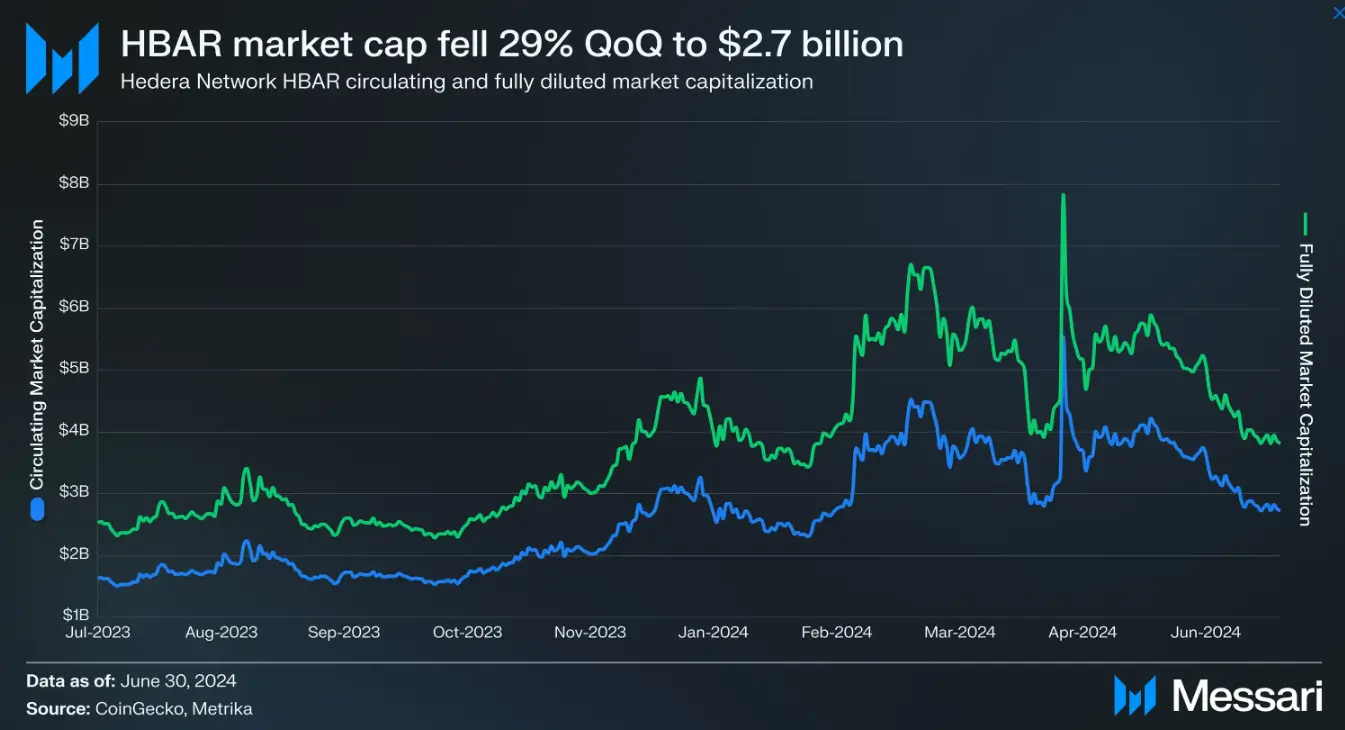
At the time, an increase in supply supported HBAR’s circulating market cap, even as its price fell by 33% QoQ, from $0.11 to $0.08. However, the token has exhibited a gloomier picture in Q3. At press time, the token’s circulating market capitalization stands at $1.891 billion.
This marks an ebb of 29.96% from the previous Q2’s value, reflecting a continued downward trend. Consequently, the token has dropped to the 42nd position in crypto market cap rankings, a decline of 12 spots from its Q2 ranking.
This ongoing decline points to sustained bearish pressure, with Hedera Hashgraph losing its competitive position against other cryptocurrencies as its market valuation diminishes further.
HBAR Retests the $0.0454 Support
Upon reaching a yearly peak of $0.1821 on April 22, Hedera Hashgraph gradually lost ground, sliding to a low of $0.0454 by August 5. This level, however, has proven to be a critical support zone, temporarily halting further decline and suggesting a potential turning point.
Yet, technical signals paint a cautious picture. The RSI, currently at 35.64 and sitting below its signal line, indicates that bearish momentum persists in the short term. With room still available before dipping into the oversold territory at 30, there’s a hint that the downtrend may not be over just yet.
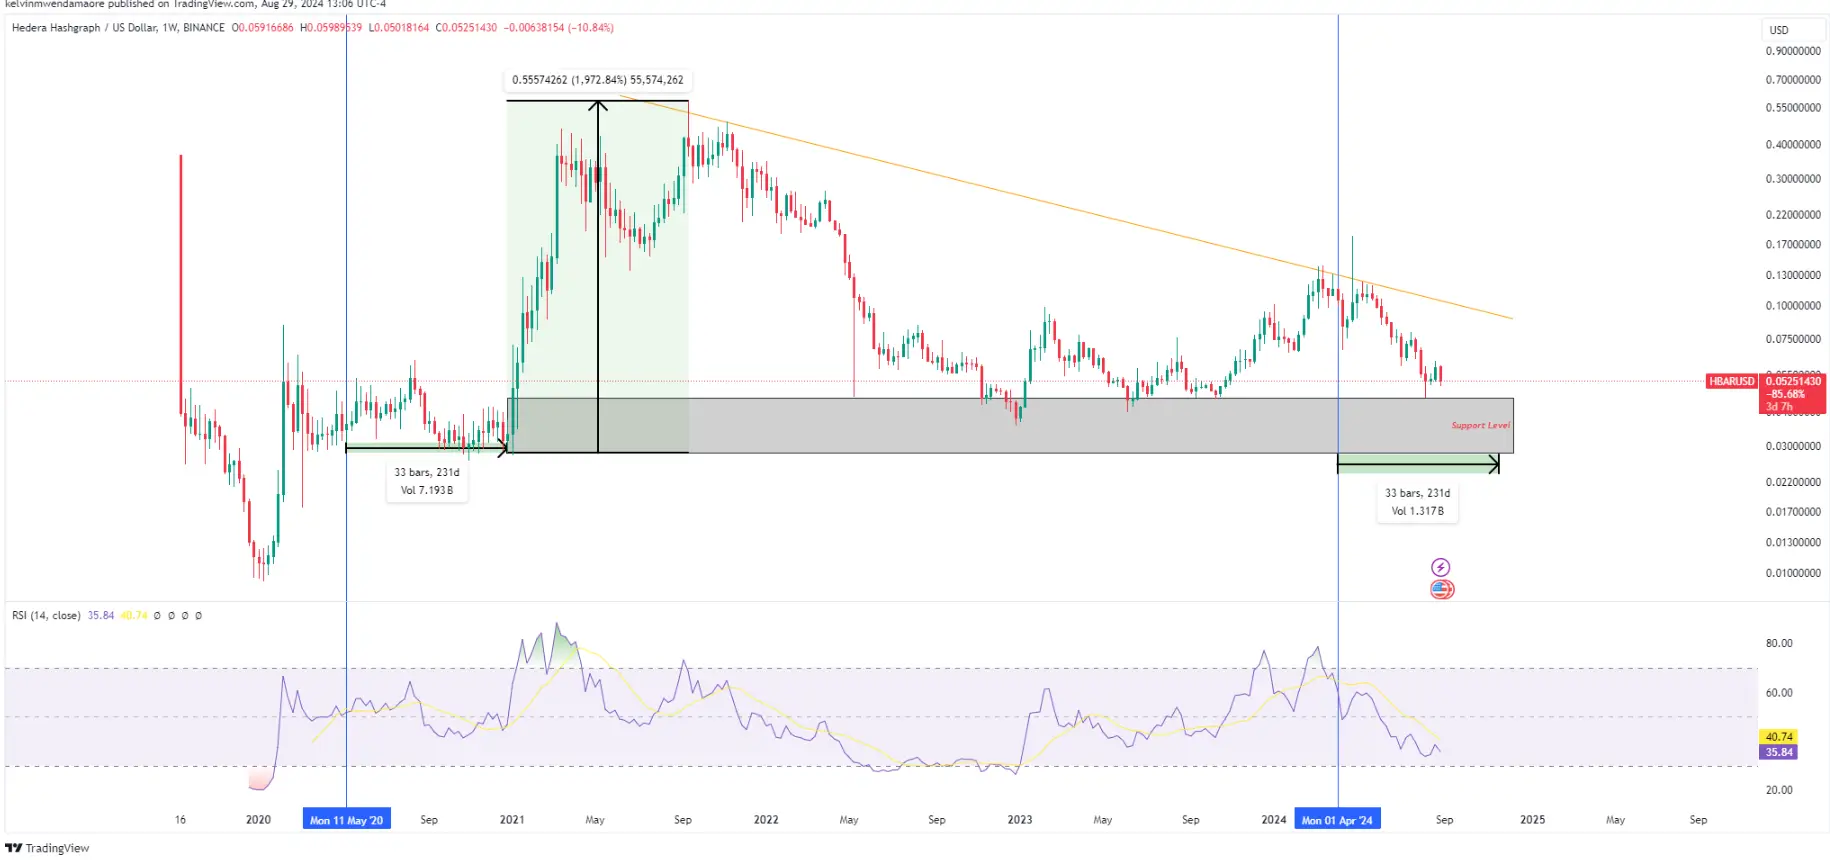
This scenario sets the stage for a possible retest of the $0.0454 support level in the coming weeks. Interestingly, historical patterns reveal it once took Hedera Hashgraph 231 days to establish a bullish foundation. Should history repeat itself, the token might now be in a consolidation phase, which could extend until mid-Q4, setting the groundwork for future gains.
Moreover, market analysts, like AllinCrypto, see this as a critical juncture in HBAR’s cycle, likening it to assets that have rallied sharply after similar patterns. Given the cyclical nature of markets—from accumulation to uptrend, distribution, and back to downtrend—the analyst believes Hedera Hashgraph could be in the early stages of accumulation, which is often a precursor to a powerful upward movement.
Such a scenario could gather steam for HBAR to challenge its bearish trendline and break free, reigniting bullish sentiment. A successful push beyond this resistance could set the stage for a renewed rally, possibly targeting this year’s peak at $0.1821 and even testing the March 2022 high of $0.2691.


