Market Expert Predicts XRP Half Pump to $27 Within Fib Channel
 thecryptobasic.com 30 August 2024 07:26, UTC
 Analyst EGRAG recently shared a projection for XRP, suggesting it could potentially experience a price surge within an identified Fib channel.
EGRAG made this forecast in his latest analysis of XRP’s price movements, leveraging its price action on the monthly chart. Interestingly, the basis of this prediction is the Fibonacci Channel, useful in determining market movements.
According to EGRAG, the rationale behind the bullish projection hinges on XRP repeating half of its 2017 bull run. For context, XRP underperformed at the start of the 2017 bull run. However, it eventually skyrocketed to hit $3.31 in January 2018 following a breakout.
XRP Could Target $27
EGRAG believes XRP has the potential to again record a massive spike if it replicates just half of that historic pump. The analyst called attention to XRP’s monthly Fibonacci levels, serving as potential resistance and support zones.
At the time of the analysis, XRP hovered around $0.57, with a notable level at $0.75 acting as a potential trigger for a more significant upward movement. EGRAG pointed out that a convincing close above the $0.75 level could open the gates for a strong rally, potentially leading to the $27 target.
If XRP breaks through the $0.75 resistance with conviction, it could indicate the start of a more sustained bullish trend. The next significant resistance would then be the 0.5 Fibonacci level. This level could act as a temporary hurdle before XRP makes its way towards the 0.618 level at $27.
Specifically, the 0.618 Fibonacci level is often regarded as a crucial point where price reversals or significant market movements can occur. EGRAG’s chart indicates that this level aligns with the $27 price target.
XRP’s Short-Term Bearish Trend
Meanwhile, on the daily chart, XRP is currently trading below both the Upper Band and the middle Band (21-day moving average) of the Bollinger Bands, as it changes hands at $0.5627. This positioning suggests that the market is currently in a bearish phase.
Furthermore, the Stochastic RSI indicators show a steep decline, with the K line at 2.59 and the D line at 5.15, both having dropped significantly from peaks above 89 on August 24.
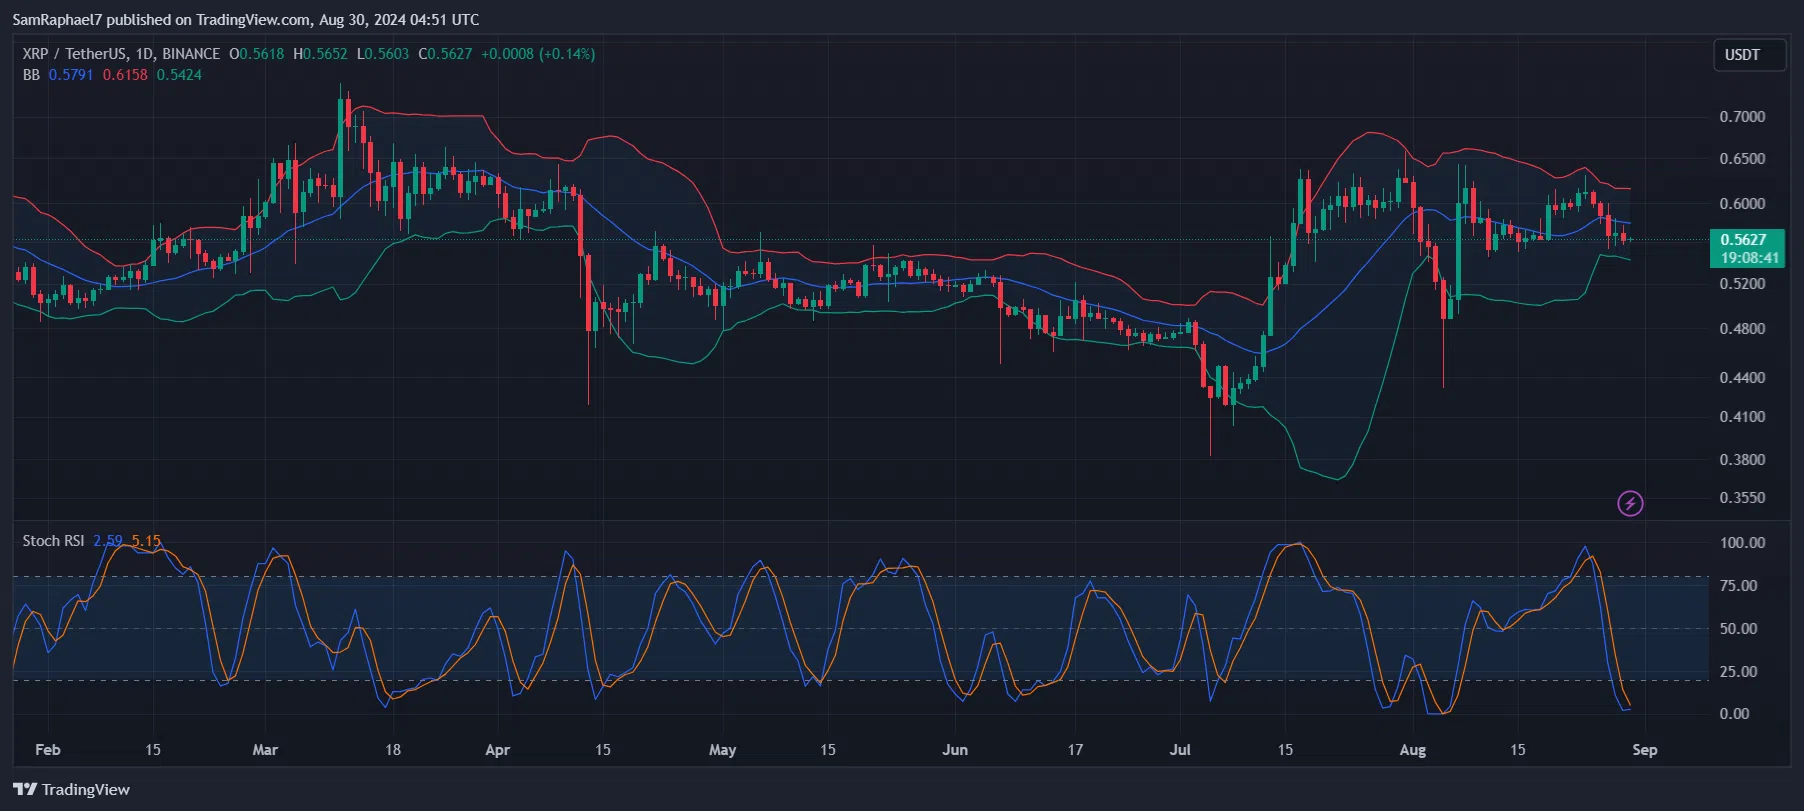
This sharp decline in the Stochastic RSI could indicate that XRP is currently oversold, which might lead to a short-term bounce as the market corrects itself. However, the downward momentum suggests that there may still be some bearish pressure in the market before a potential reversal.


