Chainlink Reversal Run Supported by On-Chain Data Eyes $12.49
 thecryptobasic.com 30 August 2024 09:31, UTC
 With a minor pullback, Chainlink sees a double-bottom reversal to ignite a breakout rally. Will the uptrend reach $12.49?
Amid increased liquidations in the market and high volatility in the DeFi segment, Chainlink is preparing for a trend reversal. The underlying sentiments are teasing a bounce back from $10.85. Is this the best dip to buy?
Bulls Back For Chainlink
In the 4-hour chart following the triangle pattern breakout, the recovery rally in Chainlink continued to reach $12.50. The recovery run, which started from $8.47 in early August, reached the pinnacle of $12.49, accounting for a 47% price jump.
The recovery run comes after a massive drop from $13.90 to the bottom support of $8.47. Based on the Fibonacci levels retraced over the correction phase, the 78.60% level at $12.49 remains a crucial resistance level.
The recent pullback from $12.49 forms a small resistance trend line. Currently, Chainlink shows a consolidation phase between the 50% and 61.80% levels at $10.85 and $11.50, respectively.
Furthermore, the 4-hour price action reveals a potential double-bottom reversal to challenge the newly formed resistance trend line.
The daily RSI line shows a massive bullish divergence between the two bottoms at the 50% Fibonacci level, reflecting high uptrend chances. Meanwhile, the MACD indicator supports the breakout chances as it prepares for a bullish crossover.
Bullish Influence Grows Over On-chain
Regarding the on-chain indicators, IntoTheBlock data reveals that 57.51% of the Chainlink volume, consisting of 575 million LINK tokens, is in the money. Thus, profitable holders hold $6.39 billion worth of LINK tokens.
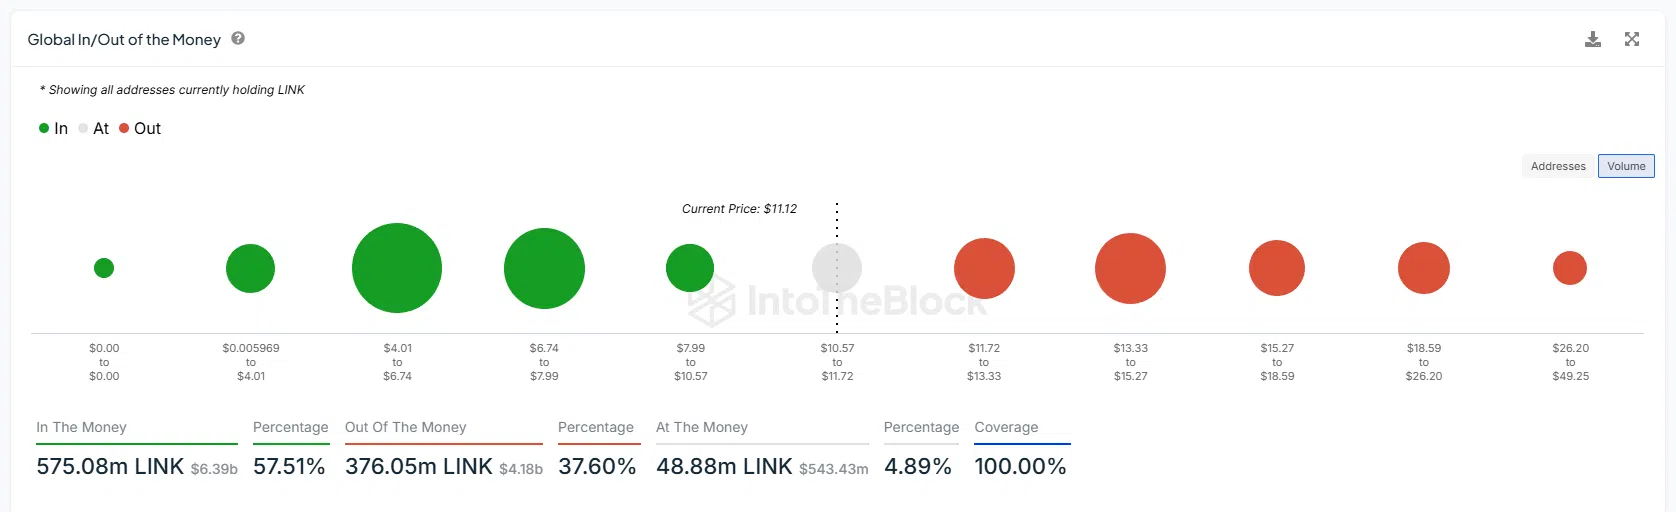
Meanwhile, 37.60% of the volume, accounting for 376 million LINK tokens, were bought at higher prices. These tokens account for $4.81 billion and are out of the money. Additionally, 48.88 million LINK tokens were bought between $10.57 and $11.72, currently at break-even points, accounting for 4.89% of the entire volume.
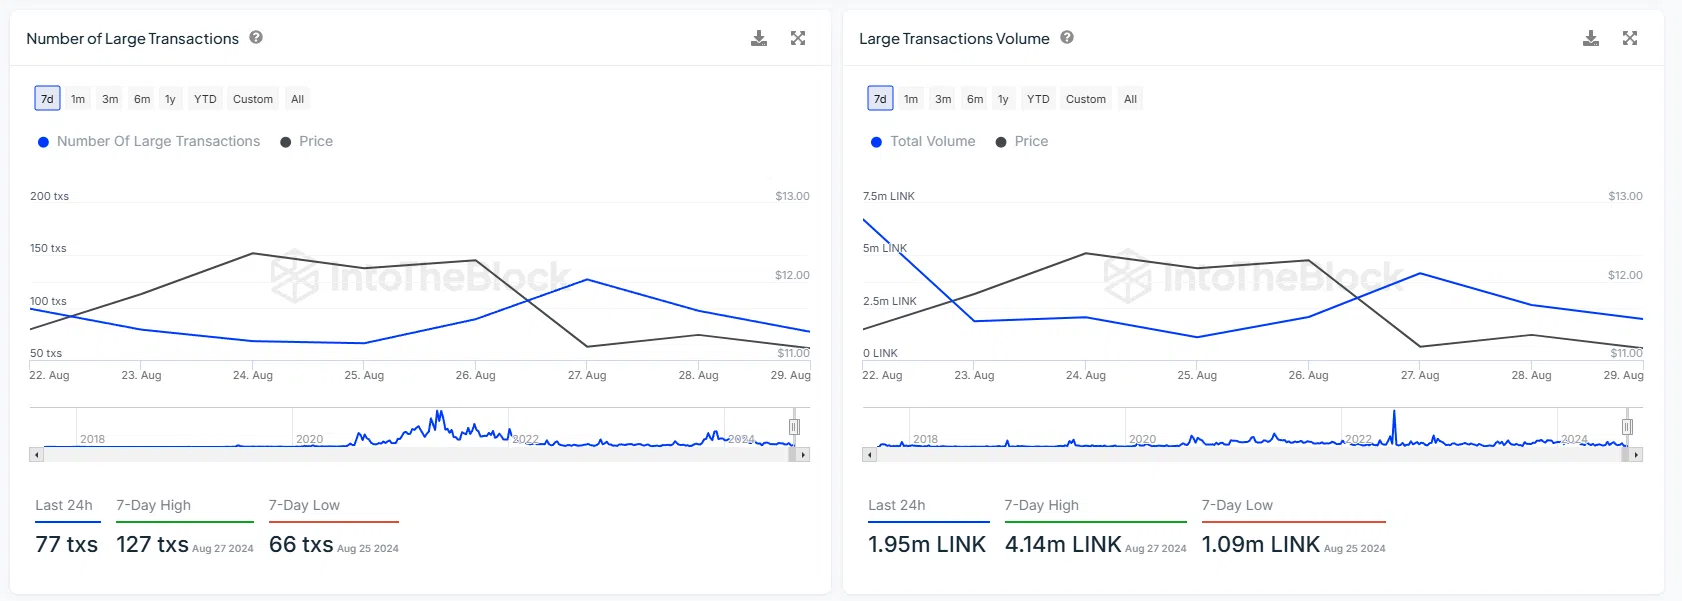
The Chainlink network shows high fluctuations in the number of last transactions and their volumes. In the last seven days, the number of transactions has dropped from 99 to 77, with the seven-day high at 127 and the lowest at 66.
The volume of these transactions has dropped massively in the last seven days, from 6.72 million to 1.95 million LINK tokens.
Will Chainlink Hit $12.49?
The Chainlink price shows two consecutive bullish candles accounting for a price jump of 1.50% and forms a morning star pattern. With a potential bullish breakout, the uptrend can find resistances at 61.80% and 78.60% levels at $11.50 and $12.49, respectively.
Following the breakout, the uptrend could reach the $13.90 peak or the $16.76 resistance level. On the bottom side, the 38.20% and 23.60% support levels are at $10.23 and $9.52, respectively.


