XRP Bollinger Bands Suggest Looming Upsurge as Volatility Drops Below 2017 Levels
 thecryptobasic.com 31 August 2024 04:42, UTC
 Market analyst Mikybull confirms that XRP Bollinger Bands volatility has slumped below the 2017 levels, suggesting an imminent upside push.
The market watcher disclosed this in a recent analysis, sharing a chart that highlights XRP’s historical price patterns since 2014. Per market data, that chart leverages Bollinger Bands to visualize the volatility levels of XRP over this period.
Notably, the bands have contracted significantly, narrowing more than they did during the 2017 rally. This pattern indicates an unprecedented reduction in volatility.
According to Mikybull, the current volatility level of XRP has fallen below the levels seen in 2017. Interestingly, this is particularly significant as the last time such low volatility was observed, XRP experienced a dramatic breakout and subsequent rally.
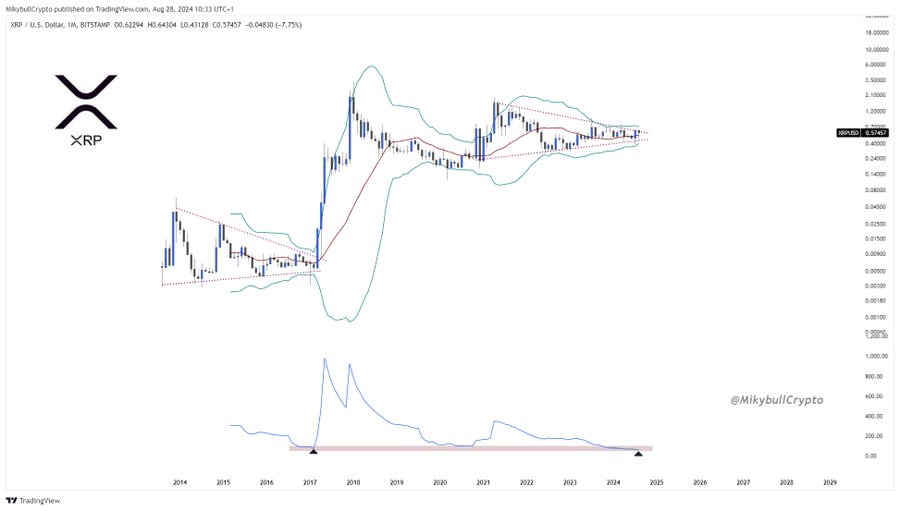
For context, XRP collapsed to a low of $0.005 in February 2017 despite the broader crypto market witnessing the pre-bull run rally. However, following the drop in volatility, as indicated by the Bollinger Bands, XRP recovered, surging to the new all-time high of $3.31 in January 2018.
Mikybull’s chart confirmed that this reduction in volatility is often a precursor to a significant price move. The analysis suggests that a similar scenario could unfold in the near future, indicating a potential bullish breakout for XRP akin to the explosive rallies in 2017 and 2020.
Supporting Analysis on Bollinger Bands
Meanwhile, JD, another notable market analyst, corroborated Mikybull’s analysis, stressing that “great minds think alike.” JD pointed to a previous analysis he made on the same price movements four days ago, suggesting that XRP is on the verge of a massive upsurge.
JD also focused on the tightening of Bollinger Bands and its implications for future price movements. According to him, in previous market cycles, the contraction of the Bollinger Bands has consistently been followed by substantial price increases.
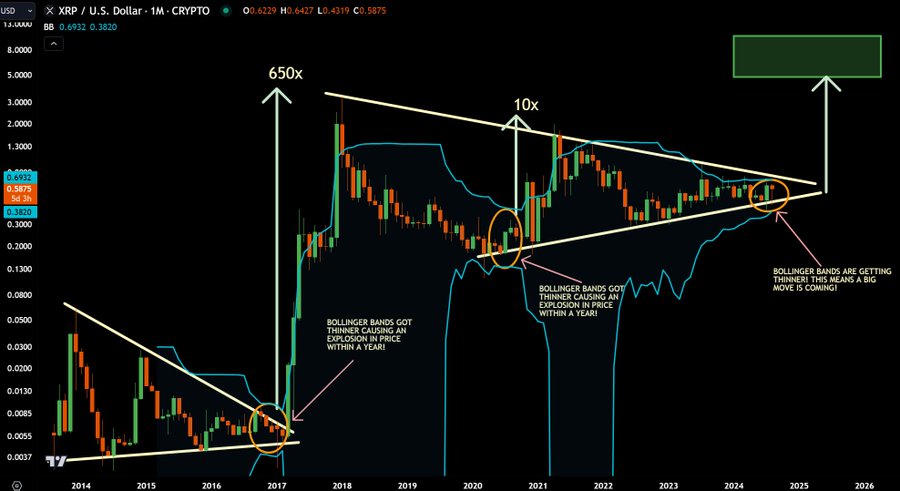
His chart spotlighted two significant points in time — 2017 and 2020 — where a similar narrowing of the Bollinger Bands occurred, leading to exponential gains of up to 650x and 10x, respectively, within a year.
JD also called attention to a pattern of symmetrical triangles formed by connecting key price points over the years. These triangles, combined with the tightening Bollinger Bands, suggest that XRP is currently in a phase of consolidation, which historically has been a setup for major price moves.
Notably, if XRP replicates half of any of its previous rallies, its price could hit greater heights. For instance, half of the 2020 upsurge, amounting to 5x, would put the asset’s price at $2.85. Meanwhile, recording half of the 2017 rally would put XRP’s upsurge at 325x, leading to a $185 price.


