
Helium Ecosystem Growth Drives HNT Price Gains, Can Rally Continue?
 thecoinrepublic.com 03 September 2024 00:59, UTC
 Helium (HNT) price has displayed a bullish bias on the daily chart. HNT price formed consistent green candles this month and over the past 7 days.
Intraday, Bitcoin (BTC) lost hold of the $58000 level, and other big players also traded in the red. Despite a dull market outlook, at the time of writing, HNT soared 3.53% in the past 24 hours and is currently trading at $7.28.
The global crypto market cap displayed a 1.79% decrease to $2.09 Trillion intraday. Market volume is down 12.17% to $66.33 Billion.
The price stayed on course this month with the 20-day EMA acting as support. The bullish momentum is increasing as the histogram turns bullish, and the RSI jumps from the middle line at 59.60.
How the Helium Ecosystem is Scaling — An Overview
Helium Mobile has reinforced its position and has displayed significant strides in the telecommunications sector. HNT has shown a healthy trend owing to Helium’s powerful DePIN narrative.
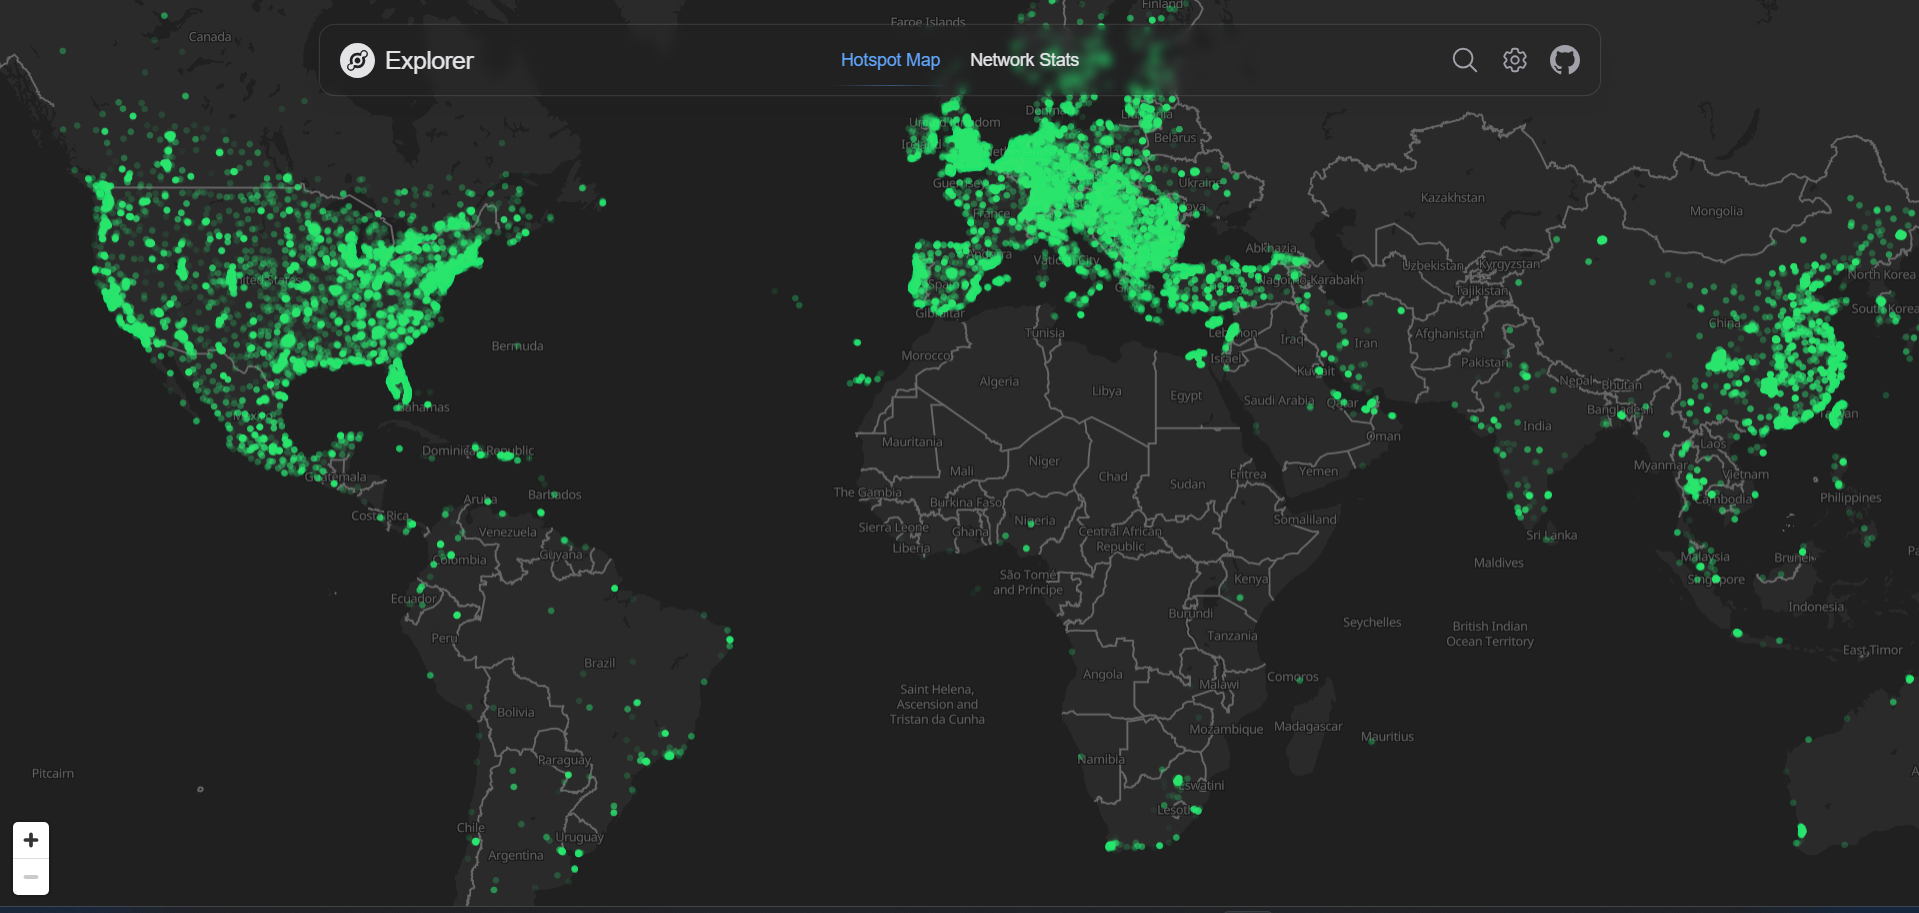
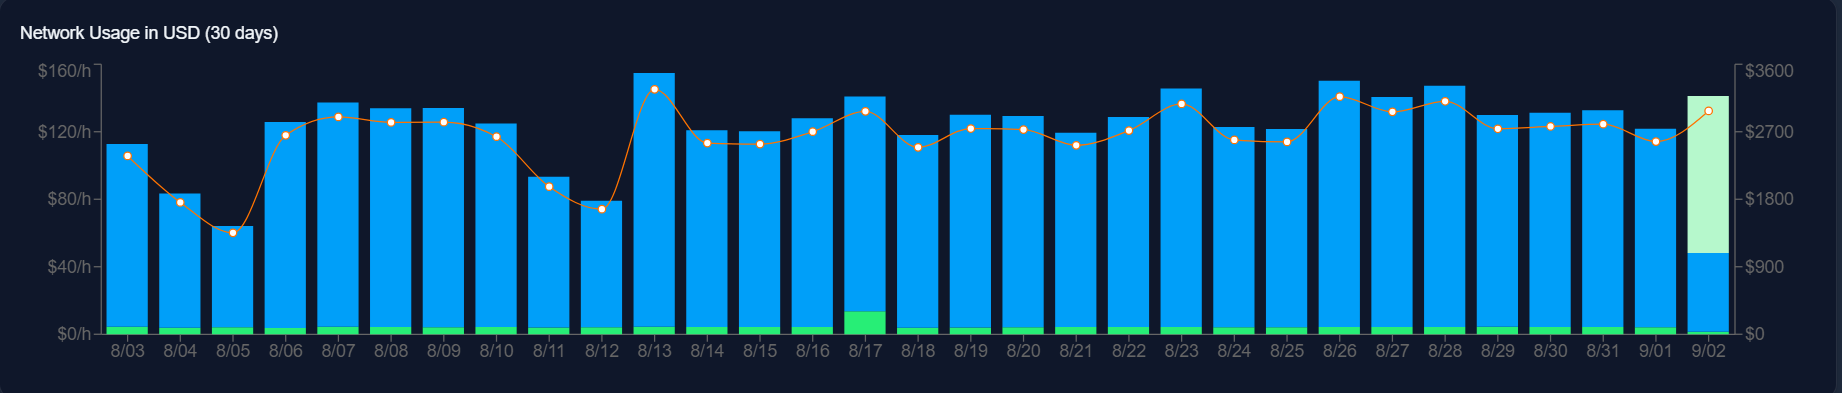
Per the Helium website, the Hotspot map showed that its network has grown significantly and has more potential. The Helium Mobile network usage in the last 30 days has shown advancements. As of September 2nd, the estimated daily total usage would reach nearly $3175.62.
Network statistics show that Helium IOT active Hotspots have grown to 357,007. The Helium Mobile hotspots have grown to 20687.
Implications of Helium Ecosystem Growth on HNT Price
HNT’s daily chart is a hive of activity. Since 2023’s last quarter, the price is up over 700%, peaking at $11.160 from the $1.429 critical demand area by the first quarter of 2024.
Thereon, the price action displayed instability, as the profit takers were on a field day. After mid-February, HNT slipped for nearly 146 days, which created a falling wedge formation.
On July 15th, 2024, the price ended its broader bullish phase. This breakout paved the way for a higher-high spree.
The $3.3-$3.5 demand zone facilitated the current trend. Over the past week, consistent gains of 17% were recorded, while this month, it displayed 57.27% gains.
The price over the long term seems optimistic, as it remained above the 50-day and 200-day EMA bands in August. $8.45 and $9.47 are clear targets for the run ahead.
There’s a higher likelihood that the crypto will jump nearly 100%, reaching $14 by year-end. However, if the price gets deflected by the $8.0 level, bears will set sights at $5.5 and $4.0 as support levels, respectively.


