
Investors are wary of Ethereum's historical negative September returns, here's why
 fxstreet.com 03 September 2024 07:51, UTC
 - Ethereum’s negative average returns in September could see the top altcoin record another month of losses.
- US products spark another week of net outflows for Ethereum ETFs.
- Ethereum price needs to move outside a key rectangle to determine its next trend.
Ethereum (ETH) is up 2% on Monday despite negative sentiment around ETH’s historical weak price action in September. Meanwhile, ETH ETFs continue their weak trend, recording another week of net outflows.
Daily digest market movers: Ethereum weak September returns, ETH ETF outflows
Several market participants are anticipating that Ethereum may see further declines in September due to its historical negative average return in the month. Since the ICO boom of 2017, ETH only recorded an average positive September return in 2019, per Coinglass data.
With an average and median return of -6.8% and -12.6%, respectively, investor sentiment going into the month is slightly negative. This also follows ETH ending August with an average loss of 22%.
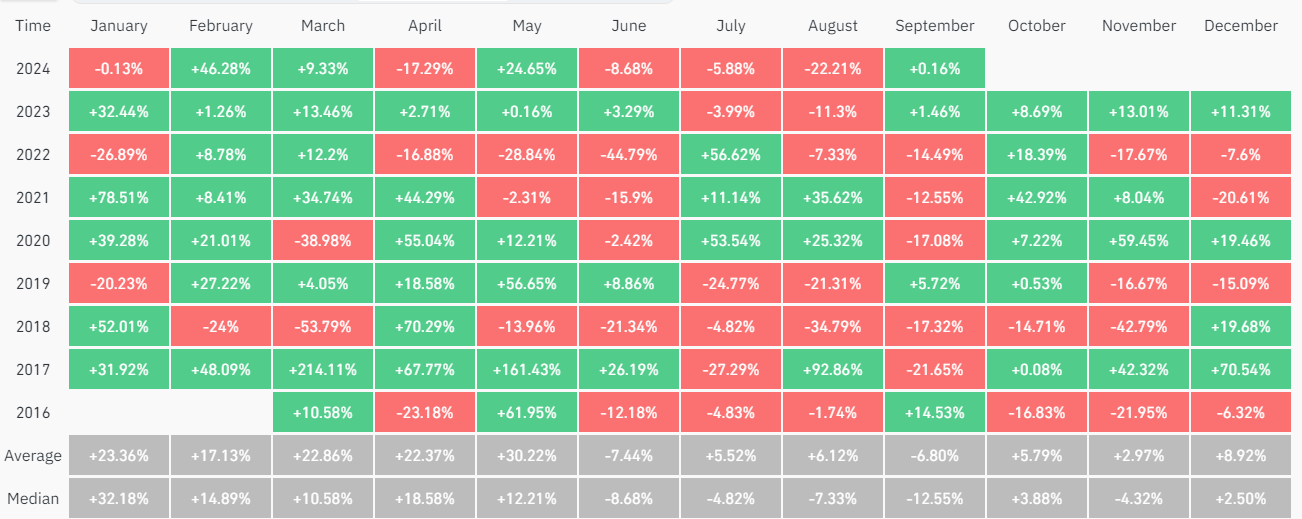
Ethereum Monthly Returns (%)
On the other hand, some investors are anticipating that a potential rate cut by the Federal Reserve (Fed) will help ETH stage a rally in September.
Meanwhile, CoinShares reported that global Ethereum exchange-traded funds (ETFs) posted net outflows of $5.7 million last week, indicating risk-averse sentiment among investors due to choppy price action. Notably, the negative flows were sparked by US spot Ethereum ETFs, which recorded a total net outflow of $12.4 million, following zero flows across the nine issuers, including BlackRock’s ETHA and Grayscale’s ETHE.
Despite the weak flows, three Ethereum ETFs feature among the top 25 ETF launches in 2024: BlackRock’s ETHA, Fidelity’s FETH and Bitwise ETHW.
*13* of top 25 ETF launches this yr are either bitcoin or ether related…
Out of approx 400 new ETFs.
Top 4 ETFs all spot btc. pic.twitter.com/gIkAiIM1jZ
— Nate Geraci (@NateGeraci) September 2, 2024
ETH technical analysis: Ethereum maintains consolidation within key rectangle
Ethereum is trading around $2,520 on Monday, up more than 2% on the day. In the past 24 hours, ETH has seen $38.49 million in liquidations, with long and short liquidations accounting for $27.59 million and $10.9 million, respectively.
On the four-hour chart, ETH is consolidating within a key rectangle with resistance at $2,817 and support at $2,400. ETH bounced off the support level on Sunday, stretching its time within the rectangle to 25 days.
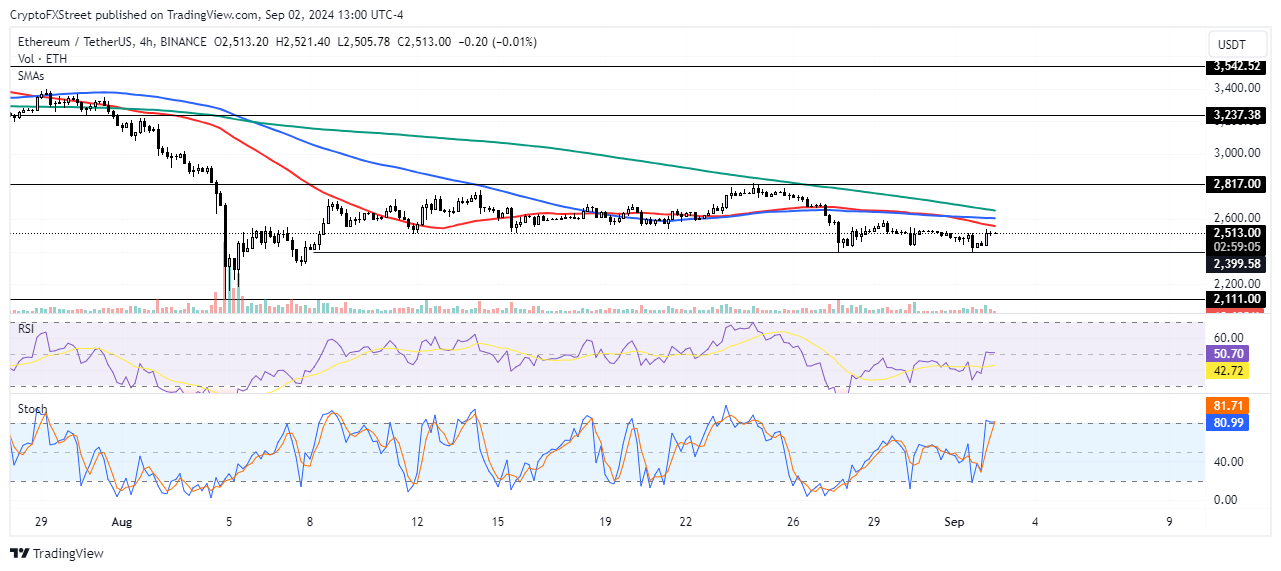
ETH/USDT 4-hour chart
The next indication of ETH’s price trend will likely be a move outside the rectangle. A breakout above the $2,817 resistance will flip it into a support and help ETH rally toward the $3,237 level. It’s important to note that the $2,817 level held as a support for nearly four months — April to July 2024. The 200-day, 100-day and 50-day Simple Moving Averages (SMA) also stand as potential resistance on the way up.
However, a move below the $2,400 level could spark bearish momentum and send ETH toward the support level around $2,111.
The Relative Strength Index (RSI) is attempting a move above its midline after crossing above its moving average line on the 4-hour chart. The %K line of the Stochastic Oscillator (Stoch) has entered the oversold region, indicating prices may see a downward correction.
A daily candlestick close below $2,111 may signal the end of the current bull cycle.
In the short term, ETH could decline to $2,416 to wash liquidation leverage worth over $32.47 million.


